
Chapter 8: AI Evaluation & Monitoring
In the previous chapter, we explored Responsible AI—the principles and practices for building agents that are fair, transparent, privacy‑preserving, safe, and accountable. We learned about bias detection, explainability, privacy, safety guardrails, and governance frameworks.
However, responsibility is not a one‑time achievement; it must be continuously verified and maintained through rigorous evaluation and monitoring. Building an AI agent is only the beginning. Once deployed, agents operate in dynamic environments where data distributions shift, customer behaviours change, and new fraud patterns emerge. Without systematic evaluation and monitoring, agents can degrade in performance, become biased, or even cause harm—often without anyone noticing until it is too late.
In banking, where decisions have significant financial and personal consequences, evaluation and monitoring are critical. They ensure that agents remain accurate, fair, safe, and compliant throughout their lifecycle. They also provide the feedback needed for continuous improvement.
In this chapter, we will explore the key concepts, techniques, and tools for evaluating and monitoring agentic AI systems. We will cover evaluation metrics, testing strategies, performance monitoring, drift detection, feedback loops, and observability. By the end, you will be able to design a comprehensive evaluation and monitoring strategy for your banking agents, ensuring they deliver value safely and reliably over time.
🎯 Learning Objectives
By the end of this chapter, you will be able to:
- Define the goals and scope of AI evaluation and monitoring in banking
- Identify key evaluation metrics for agentic systems, including accuracy, fairness, latency, and cost
- Design testing strategies for agents, including unit, integration, and end‑to‑end testing
- Implement performance monitoring and drift detection (data drift, concept drift, and prediction drift)
- Set up observability pipelines for logging, tracing, and metrics
- Establish feedback loops for continuous improvement
- Apply best practices for evaluation and monitoring in production
- Recognise common pitfalls and how to avoid them
- Prepare for regulatory audits and reporting
Why Evaluation and Monitoring Matter
AI agents are not static; they evolve over time. Their performance can degrade due to:
- Data Drift – Changes in the input data distribution (e.g., customer demographics shift).
- Concept Drift – Changes in the underlying relationship between inputs and outputs (e.g., fraud patterns change).
- Model Decay – Models become less accurate as they age.
- Bias Emergence – Fairness metrics degrade as new data introduces bias.
- Operational Issues – Latency spikes, API failures, or resource constraints.
Without monitoring, these issues go undetected, leading to poor decisions, customer dissatisfaction, regulatory violations, and financial losses.
Evaluation and monitoring provide:
- Visibility – Understanding how agents are performing in real time.
- Early Warning – Detecting degradation before it impacts customers.
- Accountability – Evidence for audits and compliance.
- Continuous Improvement – Feedback for retraining and refinement.
- Trust – Demonstrating to stakeholders that agents are reliable and safe.
Evaluation Framework for Agentic Systems
Evaluating an AI agent is more complex than evaluating a traditional ML model. Agents are not just predictors; they are decision‑makers that interact with environments, use tools, and execute multi‑step plans. A comprehensive evaluation framework must cover multiple dimensions.
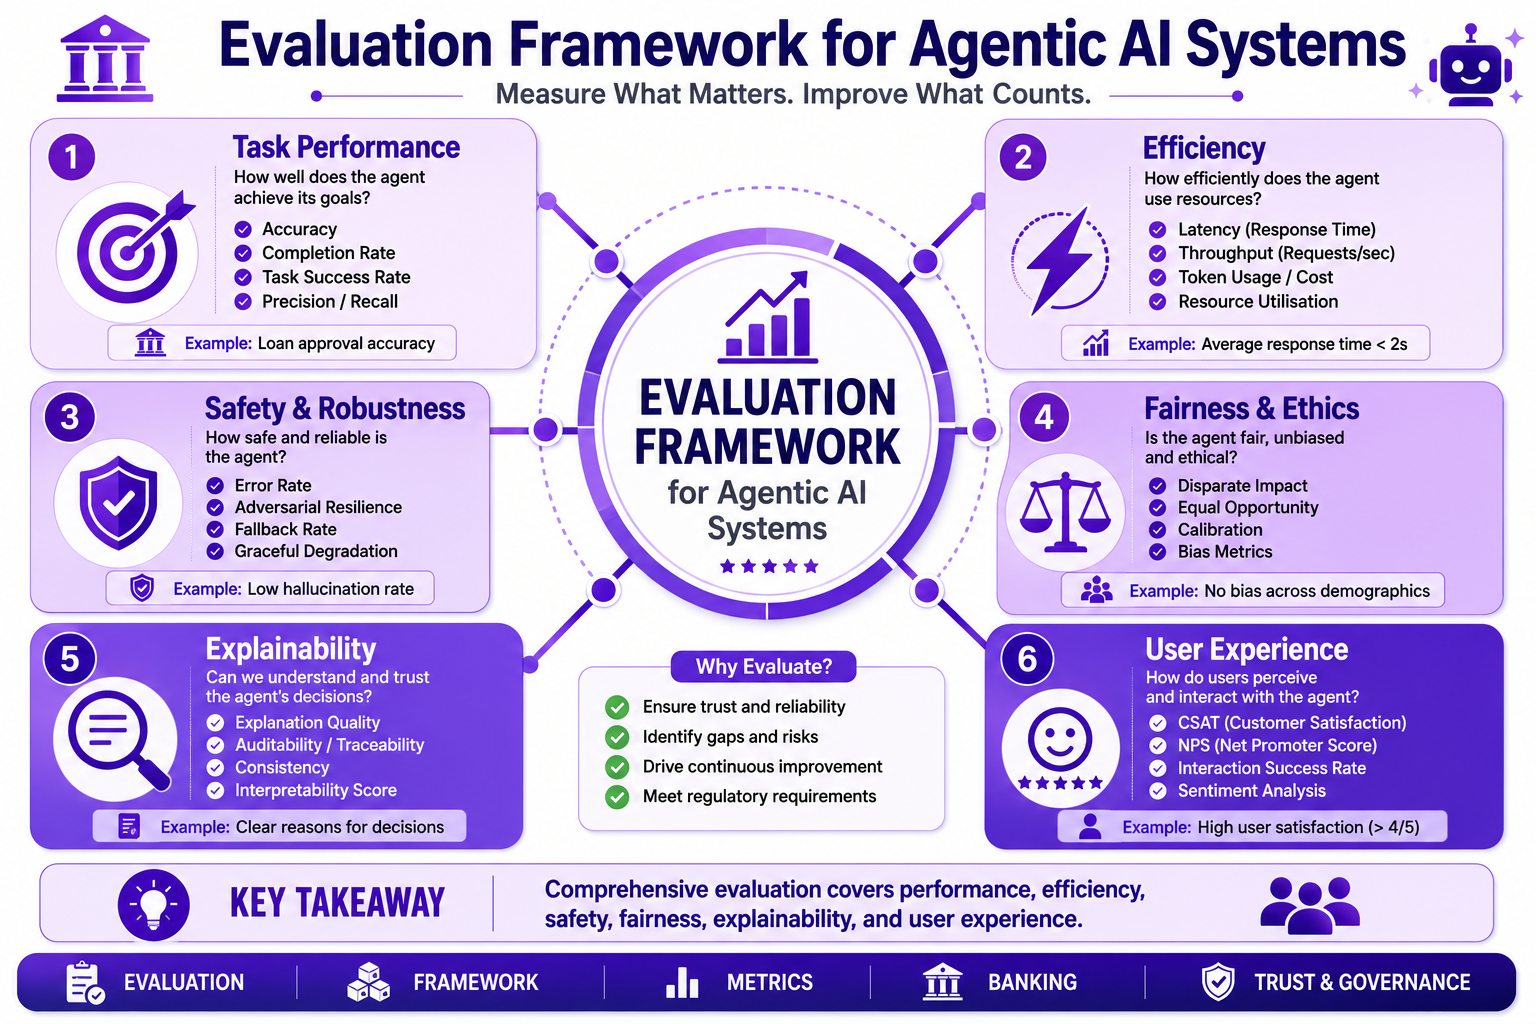
Diagram Placeholder 1: Evaluation Framework for Agentic AI
Dimension 1: Task Performance
How well does the agent achieve its goals?
| Metric | Description | Banking Example |
|---|---|---|
| Accuracy | Correctness of decisions or predictions | Loan approval accuracy vs. human underwriters |
| Completion Rate | Percentage of tasks completed successfully | Customer service queries resolved without escalation |
| Task Success | Achievement of defined goals | Fraud investigation correctly identifying fraud |
| Precision | Proportion of positive predictions that are correct | Fraud detection: flagged transactions that are actually fraudulent |
| Recall | Proportion of actual positives correctly identified | Fraud detection: actual fraud cases caught by the agent |
| F1 Score | Harmonic mean of precision and recall | Balanced measure for classification tasks |
| Mean Time to Resolution | Average time to resolve a task | Time from fraud alert to case closure |
Dimension 2: Efficiency
How quickly and cost‑effectively does the agent operate?
| Metric | Description | Banking Example |
|---|---|---|
| Latency | Time to complete a task | Response time for customer queries (p50, p95, p99) |
| Throughput | Number of tasks per unit time | Transactions processed per second |
| Token Usage | For LLM‑based agents | Cost per customer interaction |
| Resource Utilisation | CPU, memory, GPU usage | Scaling costs for peak loads |
| Cost per Task | Total cost per completed task | Cost of fraud investigation vs. manual investigation |
| API Call Volume | Number of external API calls per task | Calls to credit bureaus, identity verification services |
Dimension 3: Safety and Robustness
How safe is the agent under stress or adversarial conditions?
| Metric | Description | Banking Example |
|---|---|---|
| Error Rate | Frequency of errors or failures | Rate of incorrect loan decisions |
| Adversarial Resilience | Ability to resist attacks | Fraction of adversarial inputs that bypass guardrails |
| Fallback Rate | How often human intervention is needed | Escalation rate for complex cases |
| Graceful Degradation | Performance under partial failure | Performance when a third‑party API is down |
| Recovery Time | Time to recover from failures | Time to restore service after outage |
| Hallucination Rate | Frequency of fabricated information | Incorrect facts provided to customers |
| Policy Violation Rate | Frequency of policy or regulatory breaches | Compliance violations detected |
Dimension 4: Fairness and Ethics
How fair and unbiased are the agent's decisions?
| Metric | Description | Banking Example |
|---|---|---|
| Disparate Impact | Ratio of positive outcomes across groups | Approval rate for Group A / Approval rate for Group B |
| Equal Opportunity | Difference in true positive rates across groups | Fairness in loan approvals for different demographics |
| Equalised Odds | Equal false positive and true positive rates | Balanced performance across groups |
| Calibration | Predicted probabilities vs. actual outcomes | Risk scores calibrated across groups |
| Bias Metrics | Statistical measures of bias | Demographic parity, equalised odds, counterfactual fairness |
| Representation | Distribution of group membership in training data | Underrepresented customer segments |
| Outcome Parity | Equal outcomes regardless of group | Loan approvals, credit limits, interest rates |
Dimension 5: Explainability
How well can the agent explain its decisions?
| Metric | Description | Banking Example |
|---|---|---|
| Explanation Quality | Human‑understandable and complete | Customer satisfaction with explanations |
| Auditability | Traceability of decisions | Logs and chains‑of‑thought available for review |
| Consistency | Consistency of explanations across similar cases | Similar explanations for similar applications |
| Feature Importance | Relative contribution of input features | Key factors in loan approval decision |
| Counterfactual | What would change the decision | "If your income were higher, you would qualify" |
| Reasoning Transparency | Access to agent's reasoning steps | Chain‑of‑thought available for review |
Dimension 6: User Experience
How satisfied are end‑users with the agent?
| Metric | Description | Banking Example |
|---|---|---|
| Customer Satisfaction (CSAT) | User‑reported satisfaction | Survey scores after agent interaction |
| Net Promoter Score (NPS) | Likelihood to recommend | NPS for digital banking agents |
| Interaction Success | Resolution rate without human help | Percentage of inquiries fully resolved |
| Sentiment Analysis | User sentiment during interactions | Positive vs. negative sentiment in chat logs |
| Churn Rate | Customer attrition related to agent experience | Customers leaving after poor agent interactions |
| Adoption Rate | Percentage of users engaging with the agent | Adoption of AI‑powered banking features |
| Re‑engagement Rate | Users returning to interact with the agent | Repeat usage of the agent |
Testing Strategies for Agents
Before deployment, agents must be rigorously tested. Testing should cover all components and interactions.
Levels of Testing
1. Unit Testing
Test individual components (e.g., tool‑calling function, prompt template, validation logic) in isolation.
Banking Example: Test that the credit score retrieval tool correctly parses API responses and handles errors.
Example Test Cases:
- Tool returns expected output for valid input
- Tool handles missing data gracefully
- Tool times out and retries appropriately
- Tool logs errors correctly
2. Integration Testing
Test interactions between components (e.g., agent with tools, agent with memory, agent with orchestrator).
Banking Example: Test that the loan agent correctly calls the document verification tool and uses the result in its reasoning.
Example Test Cases:
- Agent retrieves data from tools and uses it in reasoning
- Agent handles tool failures and falls back appropriately
- Agent maintains state across multiple tool calls
- Agent correctly updates memory after actions
3. End‑to‑End Testing
Test the entire agent system in a realistic environment, simulating user interactions.
Banking Example: Simulate a full customer onboarding scenario, checking that all steps complete correctly and the final account is created.
Example Test Cases:
- Complete workflow from start to finish
- Edge cases and unusual scenarios
- Concurrent users and load testing
- Recovery from failures mid‑workflow
4. User Acceptance Testing (UAT)
Test with real or representative users to validate usability, usefulness, and satisfaction.
Banking Example: Bank employees test the fraud investigation agent on historical cases and provide feedback.
Example Test Cases:
- Business users validate decisions
- Domain experts review reasoning
- Customers test user experience
- Stakeholders approve for production
Testing Techniques
| Technique | Description | Banking Example |
|---|---|---|
| Golden Dataset | Test on a curated set of expected inputs and outputs | 1,000 loan applications with known outcomes |
| Adversarial Testing | Test with inputs designed to cause failure | Malicious prompts, edge cases, data with missing fields |
| A/B Testing | Compare two versions of the agent in a controlled environment | Comparing a new ReAct agent vs. a rule‑based system |
| Shadow Mode | Run the agent in parallel with existing systems without taking action | Agent scores transactions but does not block them; compare with real decisions |
| Simulation | Use simulated environments and users | A simulated customer service scenario with varied customer personas |
| Canary Deployment | Roll out to a small subset of users first | Deploy to 1% of customers, then gradually increase |
| Blue‑Green Deployment | Run two versions simultaneously | Route a portion of traffic to the new version |
| Chaos Engineering | Introduce failures to test robustness | Kill dependencies, introduce latency, corrupt data |
Performance Monitoring in Production
Once deployed, agents must be continuously monitored. Monitoring should cover performance, behaviour, and system health.
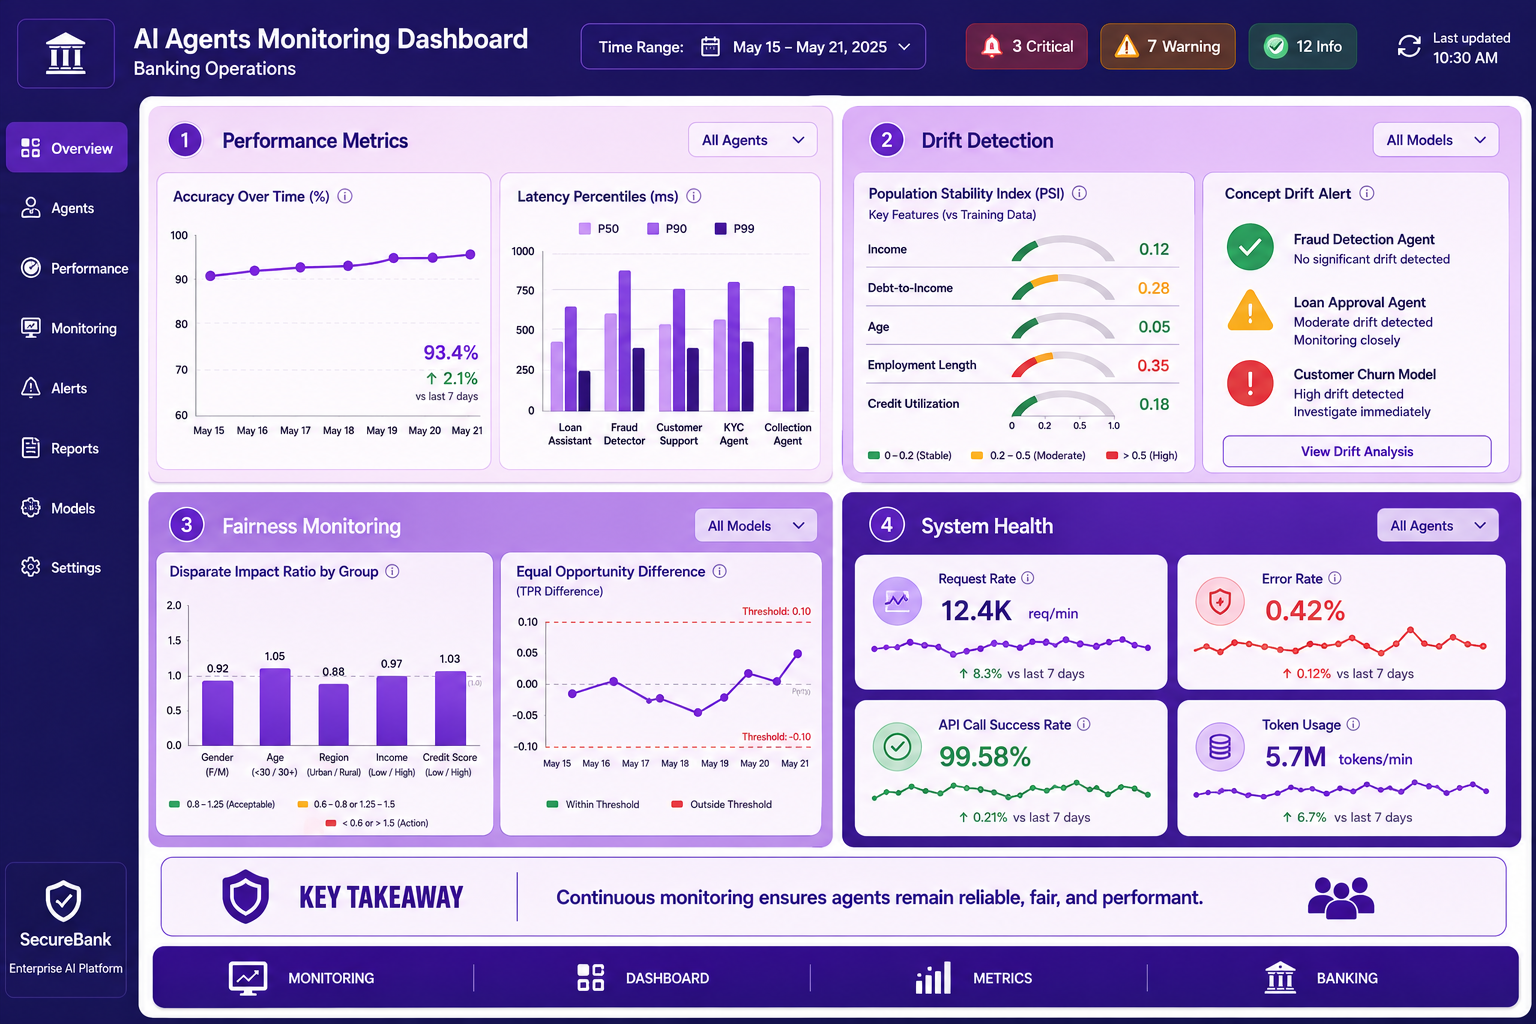
Diagram Placeholder 2: Monitoring Dashboard for AI Agents
Key Monitoring Metrics
1. Performance Metrics
- Accuracy over time (against ground truth or human‑validated data)
- Latency percentiles (p50, p95, p99)
- Throughput (requests per minute, per hour)
- Error Rates (exceptions, timeouts, fallbacks)
- Success Rate (percentage of tasks completed successfully)
2. Data Metrics
- Input Distribution – Track feature distributions to detect data drift
- Missing Values – Monitor for increasing missing data
- Outliers – Detect unusual values
- Volume – Tracking data volume over time
- Schema Changes – Detect changes in input data structure
3. Behavioral Metrics
- Action Distribution – Which actions are being taken? Have patterns changed?
- Tool Usage – Frequency and success of tool calls
- Decision Distribution – Approval rates, escalation rates, rejection rates
- Path Distribution – Which workflow paths are being taken?
- Human Escalation Rate – How often are humans being involved?
4. Resource Metrics
- CPU/Memory Usage – For infrastructure scaling
- GPU Utilisation – For model serving
- API Costs – Token usage, external API costs
- Storage – Log storage, database growth
5. Fairness Metrics
- Ongoing Disparate Impact – Monitor for emerging bias
- Drift in Fairness – Detect when fairness metrics deviate from thresholds
- Group Performance – Compare performance across demographic groups
6. Compliance Metrics
- Audit Coverage – Percentage of decisions with complete audit trails
- Regulatory Reporting – Completeness and accuracy of regulatory reports
- Policy Adherence – Percentage of decisions following policies
Monitoring Implementation
Alerting
| Alert Type | Description | Banking Example |
|---|---|---|
| Threshold Alerts | Trigger when a metric exceeds a threshold | Latency > 5 seconds for 5 minutes |
| Anomaly Detection | Trigger on unusual patterns | Error rate spikes unexpectedly |
| Trend Alerts | Trigger on sustained trends | Accuracy declining for 7 consecutive days |
| Drift Alerts | Trigger when drift exceeds threshold | PSI > 0.2 for any feature |
| Compliance Alerts | Trigger on policy violations | Disparate impact ratio > 1.25 |
Dashboard Design
| Component | Description | Banking Example |
|---|---|---|
| Summary Metrics | High‑level KPIs at a glance | Overall accuracy, success rate, avg latency |
| Time Series Charts | Trends over time | Accuracy over the last 30 days |
| Distribution Views | Current distributions | Feature distributions vs. baseline |
| Alert Feed | Recent and active alerts | Error rate spike at 2:15 PM |
| Health Indicators | System health status | API status, service uptime |
| Slicing and Filtering | Drill down capabilities | Filter by region, customer type, agent version |
Drift Detection
Drift occurs when the statistical properties of the input data or the relationship between inputs and outputs change over time.
Types of Drift
| Type | Definition | Banking Example |
|---|---|---|
| Data Drift | Change in input feature distributions | Customers' income distribution shifts due to economic changes |
| Concept Drift | Change in the relationship between features and target | Fraud patterns evolve, making old models less effective |
| Prediction Drift | Change in model outputs (even without data or concept drift) | Model's predicted approval rates change over time |
| Label Drift | Change in target variable distribution | Fraud rate increases due to new fraud strategy |
Detection Techniques
| Technique | Description | Banking Example |
|---|---|---|
| Statistical Tests | Test for distribution differences | Kolmogorov‑Smirnov test, Population Stability Index (PSI) |
| Distance Metrics | Measure distance between distributions | Wasserstein distance, Kullback‑Leibler divergence |
| Visualisation | Plot feature distributions over time | Compare current vs. baseline distributions |
| Monitoring Statistics | Track summary statistics over time | Mean, variance, percentiles over time |
| Model‑Based Detection | Use a model to detect drift | Isolation forest for outlier detection |
Thresholds and Response
| Drift Level | Action | Banking Example |
|---|---|---|
| Green (No Drift) | Continue monitoring | No action needed |
| Yellow (Warning) | Investigate and prepare | Notify data science team, begin investigation |
| Orange (Moderate) | Partial intervention | Increase monitoring frequency, consider retraining |
| Red (Critical) | Immediate action | Retrain model, rollback to previous version, escalate to human review |
Response to Drift
- Retraining – Re‑train models on new data
- Re‑evaluation – Assess fairness and safety with new data
- Rollback – Revert to a previous version if performance degrades
- Human Review – Escalate decision‑making to humans until the agent is updated
- Model Update – Update model hyperparameters or architecture
- Alerting – Notify stakeholders and trigger response plans
Observability
Observability is the ability to understand the internal state of a system from its external outputs (logs, metrics, traces). For AI agents, observability is essential for debugging, auditing, and improvement.
Pillars of Observability
1. Logging
Record detailed events and decisions.
What to Log:
| Category | Examples | Banking Example |
|---|---|---|
| Inputs | User messages, API requests, tool inputs | Customer query, transaction details |
| Outputs | Agent responses, tool results, decisions | Loan approval decision, fraud alert |
| Reasoning | Thoughts, chain‑of‑thought, planning | Agent's reasoning for approval/denial |
| Actions | Tool calls, API calls, system updates | Credit check API call, database update |
| Errors | Exceptions, failures, fallbacks | Timeout, invalid response, policy violation |
| Context | Session ID, user ID, timestamp, environment | Unique customer identifier, timestamp |
| Performance | Latency, token usage, cost | Time to resolution, token cost |
Banking Example: Log each step of a fraud investigation: transaction details, reasoning steps, API calls, final decision, and human review.
2. Metrics
Aggregate numerical measurements over time.
What to Metric:
| Category | Examples | Banking Example |
|---|---|---|
| Counts | Number of queries, decisions, actions | Daily loan applications processed |
| Rates | Error rate, escalation rate, success rate | Percentage of queries escalated to humans |
| Distributions | Latency percentiles, token usage, scores | P95 response time for fraud detection |
| Ratios | Approval ratio by demographic group | Fairness metrics |
| Resource Usage | CPU, memory, GPU utilisation | Infrastructure costs |
| Business Metrics | Cost, conversion, churn, revenue | Cost per customer interaction |
Banking Example: Track the daily approval rate for loan agents, broken down by region and customer segment.
3. Tracing
Follow a request through the system.
What to Trace:
| Element | Description | Banking Example |
|---|---|---|
| Request ID | Unique identifier for the entire flow | Trace a fraud investigation end‑to‑end |
| Spans | Individual steps in the workflow | Each agent interaction, tool call, API request |
| Timing | Duration of each span | Identify bottlenecks in the pipeline |
| Dependencies | Services, APIs, and systems called | Credit bureau API call dependency |
| Status | Success, failure, or partial success | Each span's outcome |
| Relationships | Parent‑child relationships | Orchestrator → Specialist Agent → Tool |
Banking Example: Trace a customer query from initial input, through intent classification, tool calls, reasoning, and final response, to identify bottlenecks.
Observability Tools
| Tool Type | Examples | Purpose |
|---|---|---|
| Log Aggregation | ELK Stack, Splunk, Datadog | Centralise and search logs |
| Metrics Dashboards | Grafana, Prometheus, Datadog | Visualise metrics in real time |
| Tracing Systems | Jaeger, Zipkin, AWS X‑Ray | Trace requests across services |
| Alerting | PagerDuty, Opsgenie, custom alerts | Notify on anomalies or thresholds |
| APM Tools | New Relic, Dynatrace, AppDynamics | Application performance monitoring |
| ML Monitoring | WhyLabs, Arize, Fiddler | Monitor ML models and drift |
Feedback Loops for Continuous Improvement
Monitoring is not the end; it is the beginning of a cycle of continuous improvement. Feedback loops allow agents to learn from outcomes and human input.
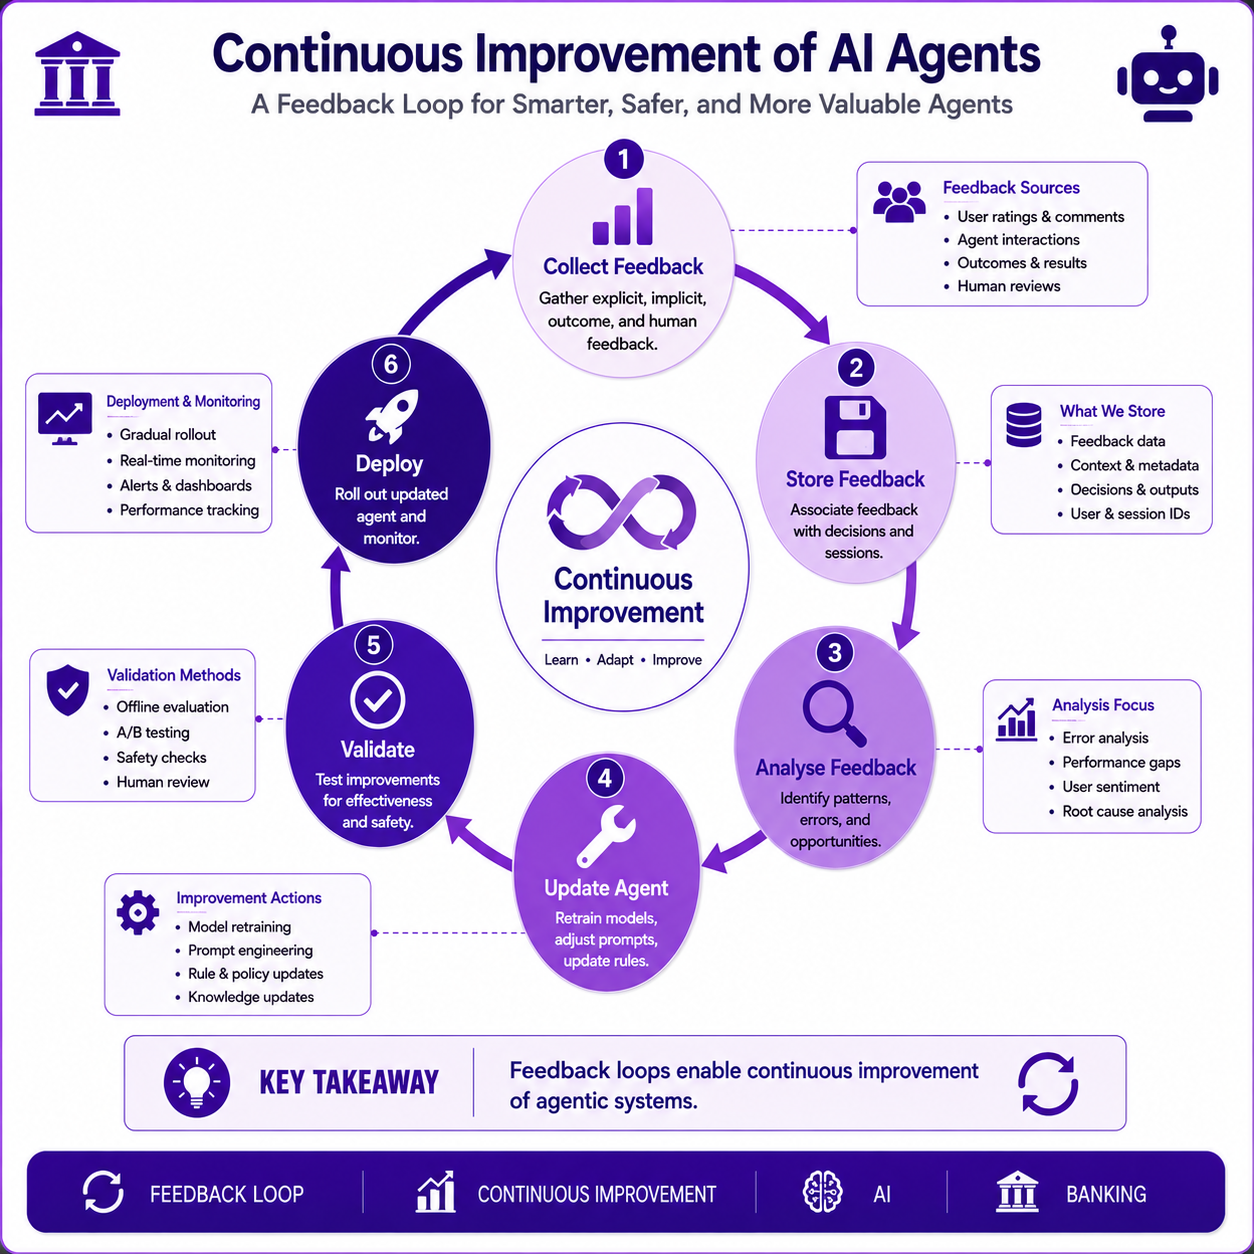
Diagram Placeholder 3: Feedback Loop for Agentic AI
Types of Feedback
1. Explicit Feedback
Users explicitly rate or comment on the agent's performance.
Banking Example: After a customer service interaction, the customer rates the agent (1‑5 stars) and provides comments.
Collection Methods:
- Star ratings
- Thumbs up/down
- Comments and suggestions
- Surveys and questionnaires
2. Implicit Feedback
User behaviour signals satisfaction or dissatisfaction.
Banking Example: If a customer repeats a query or contacts a human agent immediately after an agent interaction, that indicates dissatisfaction.
Collection Methods:
- Repeat queries (frustration)
- Early abandonment (disengagement)
- Conversational length (engagement)
- Call centre escalation (failure)
- Bounce rate (dissatisfaction)
3. Outcome Feedback
The real‑world outcome of the agent's decision.
Banking Example: For a loan approval, whether the loan was repaid on time provides outcome feedback.
Collection Methods:
- Loan repayment status
- Fraud confirmed/disconfirmed
- Customer retention/churn
- Financial outcomes
4. Human‑in‑the‑Loop Feedback
Humans reviewing and correcting agent decisions.
Banking Example: An underwriter overrides a loan agent's decision and provides a reason.
Collection Methods:
- Corrections and overrides
- Reason for override
- Additional context
- Human ratings of agent reasoning
Feedback Loop Implementation
1. Collect Feedback
Gather explicit, implicit, outcome, and human feedback.
Implementation: Instrument agent to capture feedback at each interaction. Store feedback in a structured format.
2. Store Feedback
Associate feedback with specific decisions and sessions.
Implementation: Use a feedback database with relationships to sessions, decisions, and user IDs. Include timestamps and context.
3. Analyse Feedback
Aggregate and analyse to identify patterns, errors, and improvement opportunities.
Implementation: Regular analysis of feedback data. Identify common issues, errors, and areas for improvement. Use dashboards to monitor feedback trends.
4. Update Agent
Use feedback to retrain models, adjust prompts, or update rules.
Implementation: Use feedback for:
- Retraining models
- Fine‑tuning prompts
- Updating rules and policies
- Improving tool implementations
5. Validate
Test updated agent to ensure improvements are effective and safe.
Implementation: A/B test new version against current version. Test on historical data and edge cases. Validate with human reviewers.
6. Deploy
Roll out the updated agent and monitor.
Implementation: Gradual deployment (canary). Monitor performance metrics and feedback. Prepare for rollback if needed.
7. Repeat
Continue the cycle.
Implementation: Schedule regular feedback review. Establish ongoing improvement process. Continuously monitor and improve.
Feedback Loop Governance
| Element | Description | Banking Example |
|---|---|---|
| Responsibility | Who owns the feedback loop? | Data science team, product owner |
| Frequency | How often is feedback reviewed? | Weekly review, monthly improvement |
| Thresholds | When does feedback trigger action? | Accuracy drops below 90%, fairness metric exceeds threshold |
| Process | What is the improvement process? | Documented in MLOps procedures |
| Documentation | What is documented? | Changes, reasons, and results |
| Audit | How is the process audited? | Regular compliance reviews |
Evaluation and Monitoring Across the Agent Lifecycle
| Phase | Evaluation Focus | Monitoring Focus |
|---|---|---|
| Development | Unit tests, integration tests, performance benchmarks | Not yet deployed |
| Staging | End‑to‑end tests, UAT, adversarial tests | Pre‑release metrics |
| Shadow Mode | Compare with existing system | Performance, success rate |
| Canary Deployment | Limited user base, controlled testing | Initial production metrics |
| Full Production | All evaluation dimensions | Comprehensive monitoring |
| Maturity | Continuous improvement | Real‑time monitoring, alerts |
Best Practices for Evaluation and Monitoring
✅ Define clear success metrics before deployment – Know what "good" looks like.
✅ Test early and often – Evaluate at every stage: design, development, staging, production.
✅ Automate monitoring – Use dashboards and alerts to detect issues in real time.
✅ Monitor fairness continuously – Fairness can degrade even if accuracy remains stable.
✅ Log everything – Comprehensive logs are essential for debugging, auditing, and compliance.
✅ Set up alerts with appropriate thresholds – Avoid alert fatigue; focus on actionable alerts.
✅ Periodically review and update evaluation criteria – As the business and environment change, so should your metrics.
✅ Incorporate human feedback – Humans provide valuable insights that automated metrics cannot capture.
✅ Test for edge cases and adversarial inputs – Do not assume agents will only see "normal" inputs.
✅ Document your monitoring strategy – Ensure all stakeholders understand how agents are evaluated.
✅ Implement gradual deployment – Use canary deployments to reduce risk.
✅ Maintain rollback capability – Be prepared to revert to previous versions.
✅ Monitor dependencies – Track external APIs and third‑party services.
✅ Have a response plan – Know what to do when alerts fire.
Common Mistakes
❌ Monitoring only accuracy, ignoring fairness and safety – Accuracy is not enough; agents can be accurate but biased or unsafe.
❌ Not setting up monitoring before deployment – Wait until issues arise, then scramble to implement monitoring.
❌ Ignoring drift until it causes problems – Drift can be gradual; detect it early and respond proactively.
❌ Over‑relying on aggregate metrics – Aggregates hide issues in subgroups; segment by demographics, regions, etc.
❌ Not acting on alerts – Alerts are useless without a defined response plan.
❌ Forgetting to monitor external dependencies – Third‑party APIs can fail or change behaviour.
❌ Not updating evaluation frameworks – As agents evolve, evaluation must evolve too.
❌ Underestimating storage and cost – Comprehensive logging can be expensive; plan for it.
❌ Ignoring business metrics – Technical metrics alone are insufficient; track business outcomes.
❌ Not involving stakeholders – Include business, compliance, and customer success teams.
Interview Questions
-
Why is evaluation and monitoring important for AI agents in banking?
-
What are the six dimensions of evaluation for agentic systems?
-
Describe the different levels of testing for AI agents (unit, integration, end‑to‑end, UAT).
-
What is drift? Explain data drift, concept drift, prediction drift, and label drift.
-
How would you set up a monitoring dashboard for a loan approval agent?
-
What is observability and why is it important for agentic systems?
-
How do you implement a feedback loop for continuous improvement?
-
What metrics would you track to ensure fairness in a fraud detection agent?
-
How do you detect bias in production?
-
What are the common pitfalls in monitoring AI agents and how can you avoid them?
-
What is the difference between logging, metrics, and tracing?
-
How do you set up alerts for agent monitoring?
-
What is the role of human feedback in agent improvement?
-
How do you handle concept drift in production?
-
What is shadow mode and why is it useful?
Practice Exercises
-
Design an Evaluation Framework – Design a complete evaluation framework for a customer service agent. Include metrics for task performance, efficiency, safety, fairness, explainability, and user experience. Define success thresholds for each metric.
-
Write a Test Plan – Write a test plan for a loan origination agent, including unit, integration, end‑to‑end, and UAT tests. Provide example test cases for each level.
-
Build a Monitoring Dashboard – Build a monitoring dashboard mock‑up for a fraud detection agent. Show the metrics you would track and how alerts would be configured. Include sample visualisations.
-
Implement Drift Detection – Design a drift detection strategy for a credit scoring model. Describe the statistical tests you would use, how often you would run them, and the response plan for different drift levels.
-
Design a Feedback Loop – Design a feedback loop for a wealth management agent that provides investment recommendations. How would you collect, store, analyse, and use feedback to improve the agent?
-
Observability Implementation – Define the logging, metrics, and tracing strategy for a customer service agent. What would you log? What metrics would you track? How would you trace interactions?
-
Alerting Strategy – Design an alerting strategy for a loan processing agent. Define thresholds for performance, fairness, and safety. Include escalation paths.
Key Takeaways
- Evaluation and monitoring are essential to ensure agents remain accurate, fair, safe, and compliant over time.
- A comprehensive evaluation framework covers task performance, efficiency, safety, fairness, explainability, and user experience.
- Testing strategies include unit, integration, end‑to‑end, adversarial, A/B, and shadow testing.
- Monitoring must track performance metrics, data distribution, behaviour, resource usage, and fairness.
- Drift (data, concept, prediction) must be detected and responded to promptly.
- Observability (logs, metrics, traces) is critical for debugging and auditing.
- Feedback loops enable continuous improvement through explicit, implicit, outcome, and human feedback.
- Best practices include defining metrics early, automating monitoring, and incorporating human oversight.
- Common mistakes include ignoring fairness, not acting on alerts, and underestimating monitoring complexity.
Chapter Summary
In this chapter, you learned:
- The importance of evaluation and monitoring for production agentic systems in banking
- A multi‑dimensional evaluation framework covering performance, efficiency, safety, fairness, explainability, and user experience
- Testing strategies from unit to end‑to‑end, including adversarial and shadow testing
- Performance monitoring metrics and drift detection techniques
- The three pillars of observability: logging, metrics, and tracing
- How to build feedback loops for continuous improvement
- Best practices and common mistakes to avoid
You now have a comprehensive toolkit for evaluating, monitoring, and improving AI agents throughout their lifecycle. This knowledge completes your journey through the Agentic AI Foundations course. You are now equipped to design, build, deploy, and responsibly operate agentic AI systems in banking and beyond.