
Chapter 5: Processes, Services, and System Monitoring
Learn to inspect running processes, understand basic system resource indicators, check services where the environment supports them, and follow a safe troubleshooting workflow. These skills are useful for developers, support engineers, and Linux administrators.
Lab environment: Ubuntu on WSL 2, an Ubuntu virtual machine, or an approved browser terminal. Start with observation commands and synthetic examples. Service-management commands vary across environments; WSL2 and browser terminals may not run a full
systemdsetup.
Learning objectives
By the end of this chapter, you should be able to:
- Explain the difference between a command, a process, and a service.
- Identify PID and PPID and inspect process details.
- Observe CPU/load, memory, and filesystem capacity.
- Use
ps,top,pgrep,free,df, anduptimeappropriately. - Explain when
systemctlandjournalctlmay be available. - Collect evidence before making a change or escalating a problem.
- Avoid terminating processes or changing services without authorisation.
1. Industry scenario: an application feels slow
A team reports that a web application has become slow. The symptom alone does not tell us the cause. A process may be consuming resources, memory may be constrained, a filesystem may be nearly full, or a dependent service may be unhealthy. The administrator needs to gather evidence before deciding what to do.
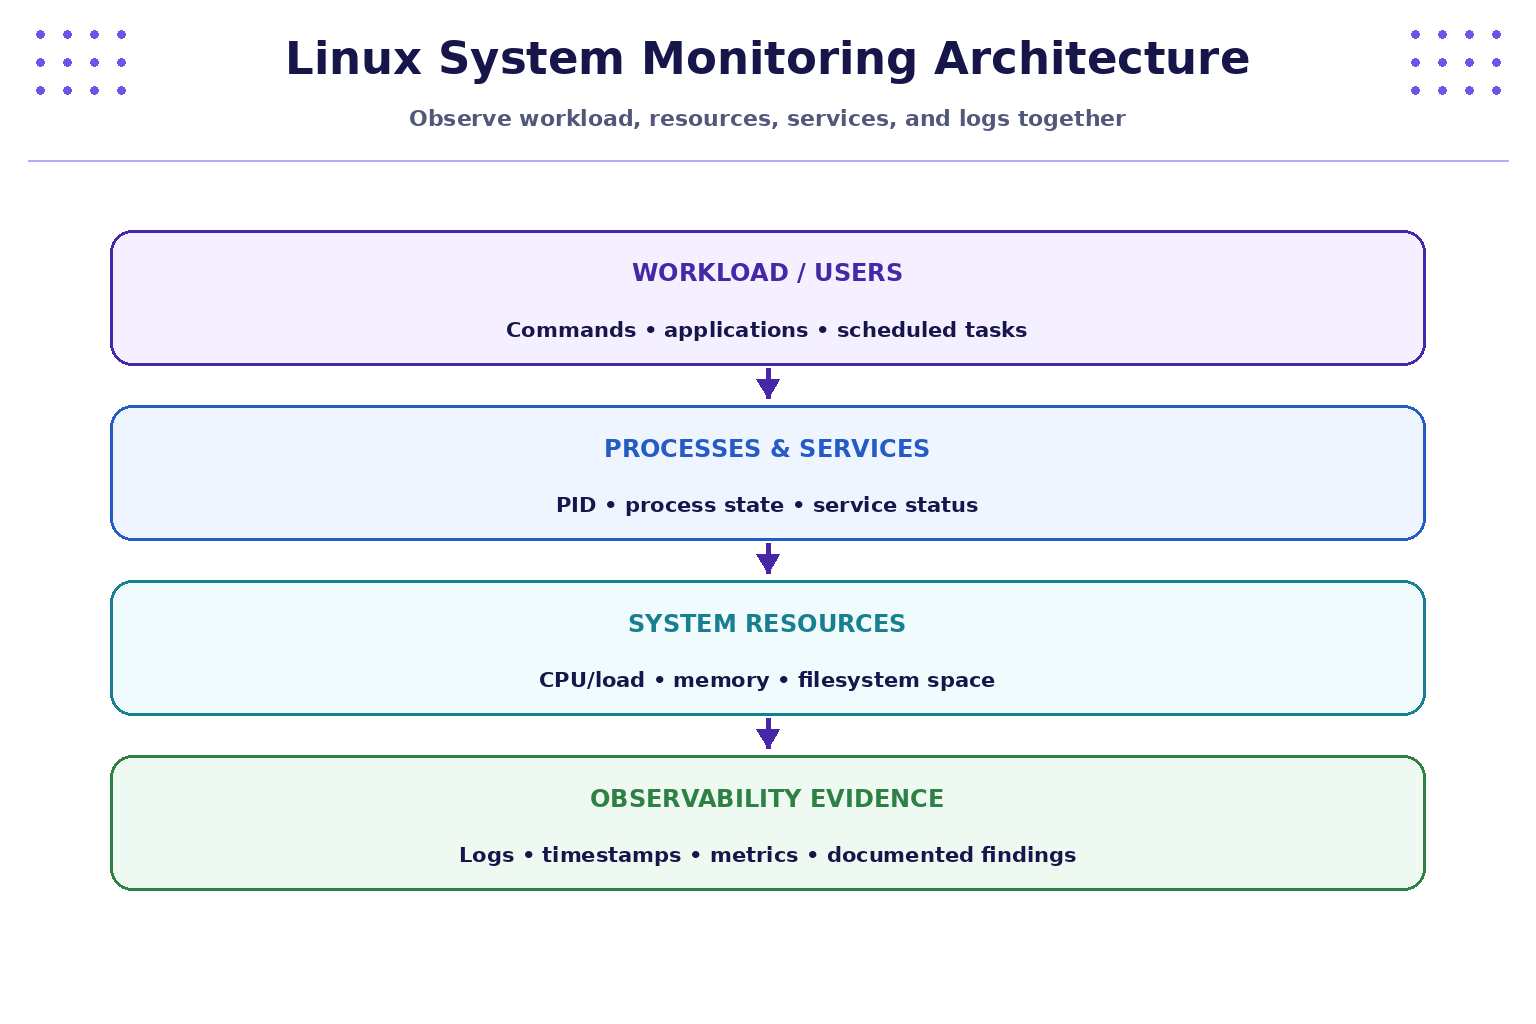
A safe initial workflow is:
- Describe the symptom and its start time.
- Inspect relevant processes and system resource indicators.
- Check service status and logs only where supported and authorised.
- Form a hypothesis based on evidence.
- Follow the approved change or escalation process.
- Verify recovery and document the result.
2. Quick reference: process and monitoring commands
| Command | Brief description | Common options / notes | Simple examples |
|---|---|---|---|
ps |
Display process information. | aux is a common BSD-style combination; -ef is another common form. |
ps aux · ps -ef |
top |
Interactive process and resource monitor. | Press q to quit. Keys vary by implementation. |
top |
pgrep |
Find process IDs by process name/pattern. | -a show command line on common implementations; -x exact name. |
pgrep -a bash |
pstree |
Display process hierarchy. | May need installation; options vary. | pstree |
pidof |
Find PIDs for a named program. | Availability varies. | pidof sshd |
uptime |
Show uptime and load averages. | No common options needed. | uptime |
free |
Display memory usage. | -h human-readable units. |
free -h |
df |
Report filesystem space. | -h human-readable; -T show filesystem type on common systems. |
df -h |
du |
Estimate file/directory space use. | -s summary; -h human-readable. |
du -sh ~/linux-lab |
sleep |
Wait for a specified interval; useful for a harmless demo process. | Takes a duration. | sleep 120 |
jobs |
List jobs started in the current shell. | Shell built-in; output is shell-specific. | jobs |
systemctl status |
Show service/unit status on systemd systems. | Service availability and permissions vary. | systemctl status cron |
journalctl |
Read the systemd journal where available. | -b current boot; -u UNIT filter by unit. |
journalctl -b · journalctl -u cron |
dmesg |
Display kernel ring-buffer messages where permitted. | -T human-readable timestamps on supported systems. |
dmesg |
watch |
Repeat a command periodically. | -n SECONDS update interval. |
watch -n 2 uptime |
kill -l |
List signal names/numbers. | Does not terminate a process. | kill -l |
man COMMAND |
Read command documentation. | -k searches descriptions. |
man ps · man top |
Important: ps, top, free, df, and uptime are usually suitable for observation in a personal lab. systemctl, journalctl, and dmesg may be unavailable or restricted in browser terminals or WSL configurations. Do not terminate a process just because its name is unfamiliar.
3. What is a process?
A process is a running instance of a program. When a shell starts a command, the operating system creates or schedules a process to execute it.
- PID: Process ID; identifies a process while it exists.
- PPID: Parent Process ID; identifies the process that started it.
- Process state: A short representation of whether a process is running, sleeping, stopped, or in another state. State letters and details can vary by tool.
- Foreground process: Runs attached to the shell's current interaction.
- Background job: A shell job allowed to run while the shell accepts further commands. Shell job control is not identical to system-wide process management.
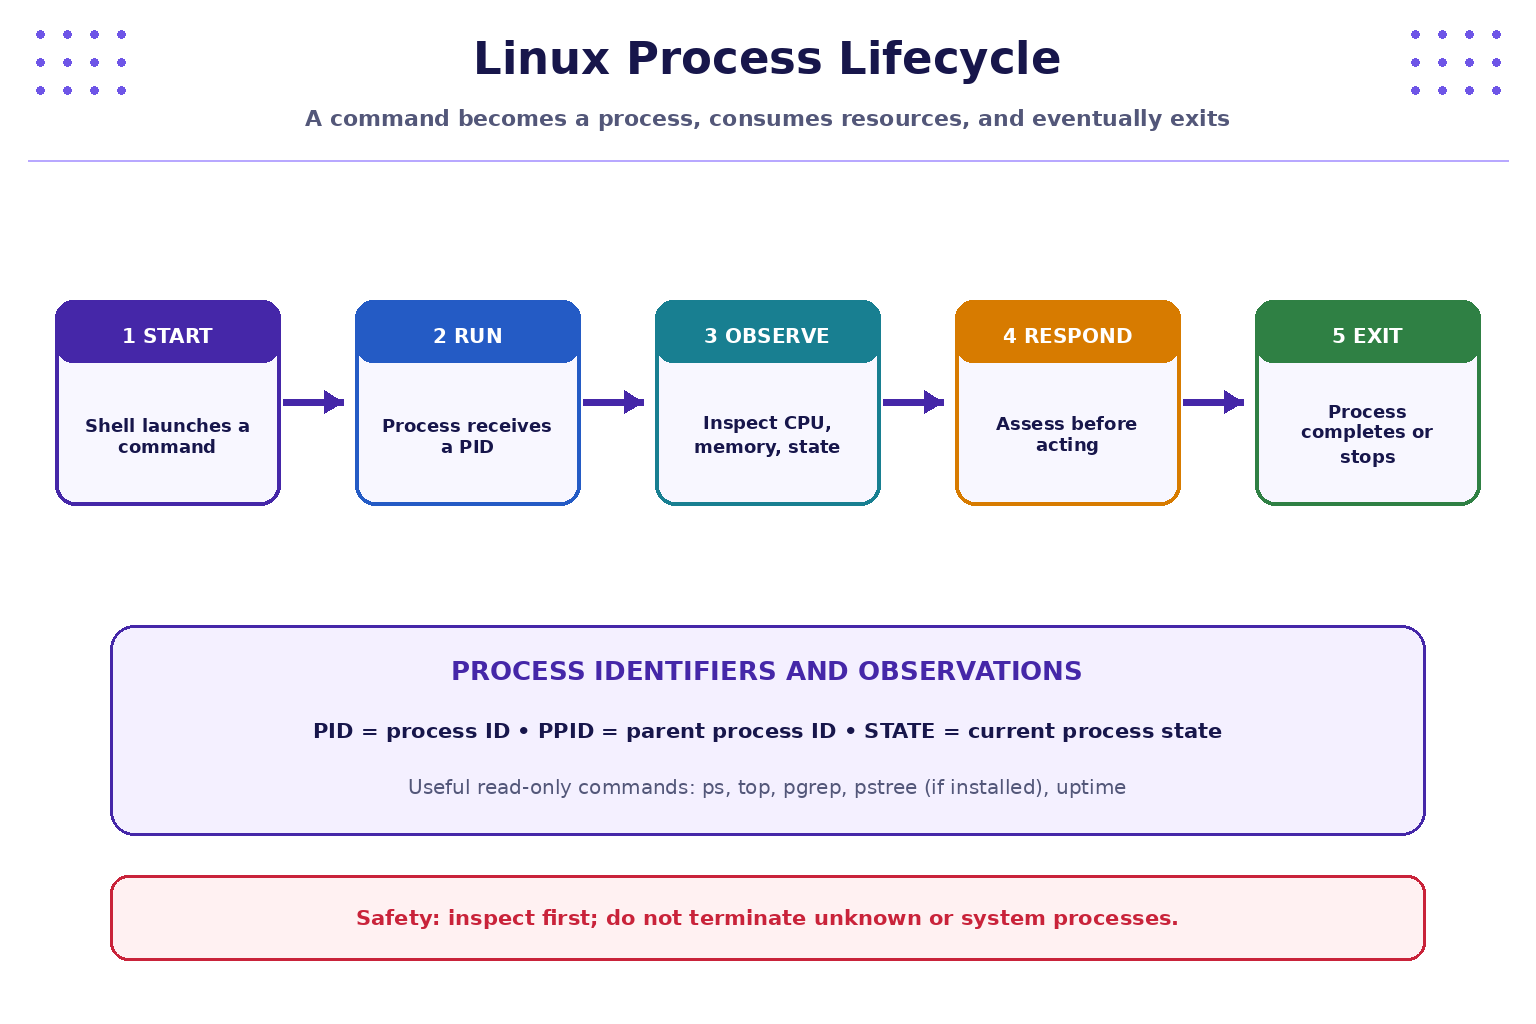
Inspect processes:
ps
ps aux | head
ps -ef | head
pgrep -a bash
The exact rows depend on your system. In ps aux, common columns include user, PID, CPU and memory percentages, state, start time, and command. Use ps --help or man ps to confirm options for your distribution.
Harmless process observation
In your own terminal, start a harmless wait command:
sleep 120 &
jobs
pgrep -a sleep
ps aux | grep '[s]leep 120'
The & asks the shell to start the command in the background. If the environment permits job control, jobs lists shell jobs. pgrep and ps inspect processes system-wide or within their permitted view. The process may not appear in every command if it finishes, is hidden by environment restrictions, or the pattern differs.
Do not use kill on an unknown or system process. For this exercise, you can let the short-lived demo process finish naturally.
4. Understand load, memory, and disk space
A system's performance cannot be diagnosed from one number alone.
| Command | What it helps answer | What it does not prove by itself |
|---|---|---|
uptime |
How long the system has run and what load averages are reported. | That a particular application is slow or that CPU is the only bottleneck. |
free -h |
How memory and swap are being reported. | That all displayed “used” memory is unavailable; Linux uses memory for caching. |
df -h |
How much space is available on mounted filesystems. | Which specific directory or file consumes the space. |
du -sh DIR |
Approximate space used under a directory. | That deleting the largest item is safe or authorised. |
top |
A changing view of processes and resource activity. | The root cause without context and repeated observation. |
Try:
uptime
free -h
df -h
du -sh ~/linux-lab 2>/dev/null
If ~/linux-lab does not exist, use a directory you created for practice. The final command redirects standard error to /dev/null so a missing directory warning does not appear; while learning, it is also useful to run the command without that redirection to understand the error.
Quick interpretation
- High load: investigate CPU activity, runnable tasks, and possible I/O waits; compare against the system's CPU count and normal baseline.
- Memory pressure: inspect trends and relevant processes; do not assume that all cache usage is a problem.
- Filesystem nearly full: identify the affected mount, then investigate usage with approved tools. Never delete logs or application data just to make the percentage fall.
- One busy process: confirm its purpose and owner before proposing any action.
5. Practical lab A — process inspection
Run the following in your own permitted environment:
whoami
ps
ps aux | head
pgrep -a bash
uptime
Record:
- One PID from your
psoutput. - The command associated with that PID.
- One difference between
psandtop. - The load averages shown by
uptime, if available. - One limitation of drawing conclusions from a single snapshot.
Expected result: outputs vary by system and time. There is no single correct PID or load average.
6. Practical lab B — resource snapshot
Run:
free -h
df -h
du -sh ~/linux-lab
If you have not created ~/linux-lab, first create your own practice directory or substitute a directory you own.
Complete this table:
| Observation | Your result | Follow-up question |
|---|---|---|
| Filesystem with least available space | Is this expected for the lab system? | |
| Memory/swap observation | Is this a single snapshot or a trend? | |
| Approximate size of your lab folder | Which files account for the usage? | |
| One uncertainty | What additional evidence would help? |
Do not delete files as part of this exercise. Resource values are environment-specific.
7. Services and logs: only where supported
A service is a background component managed by an operating-system service manager or another supervisor. On many modern Ubuntu systems, systemd manages services; some WSL2 installations and browser terminals do not run a complete systemd environment.
Check whether systemctl is available:
systemctl --version
If the environment uses systemd and your account is permitted to inspect services, try a known service name such as:
systemctl status cron
The service may not be installed or may have a different name. A failed status query does not by itself mean the entire system is broken.
Where journalctl is available and access is permitted:
journalctl -b -n 20
journalctl -u cron -n 20
These commands inspect recent journal entries; the second filters by a unit name. Output can contain sensitive operational details, so do not copy it into public forums or shared documents without approval.
If systemctl or journalctl is unavailable, record that limitation and continue with the process/resource labs. Do not attempt to install services or change the terminal configuration just to complete this chapter.
8. Safe troubleshooting workflow
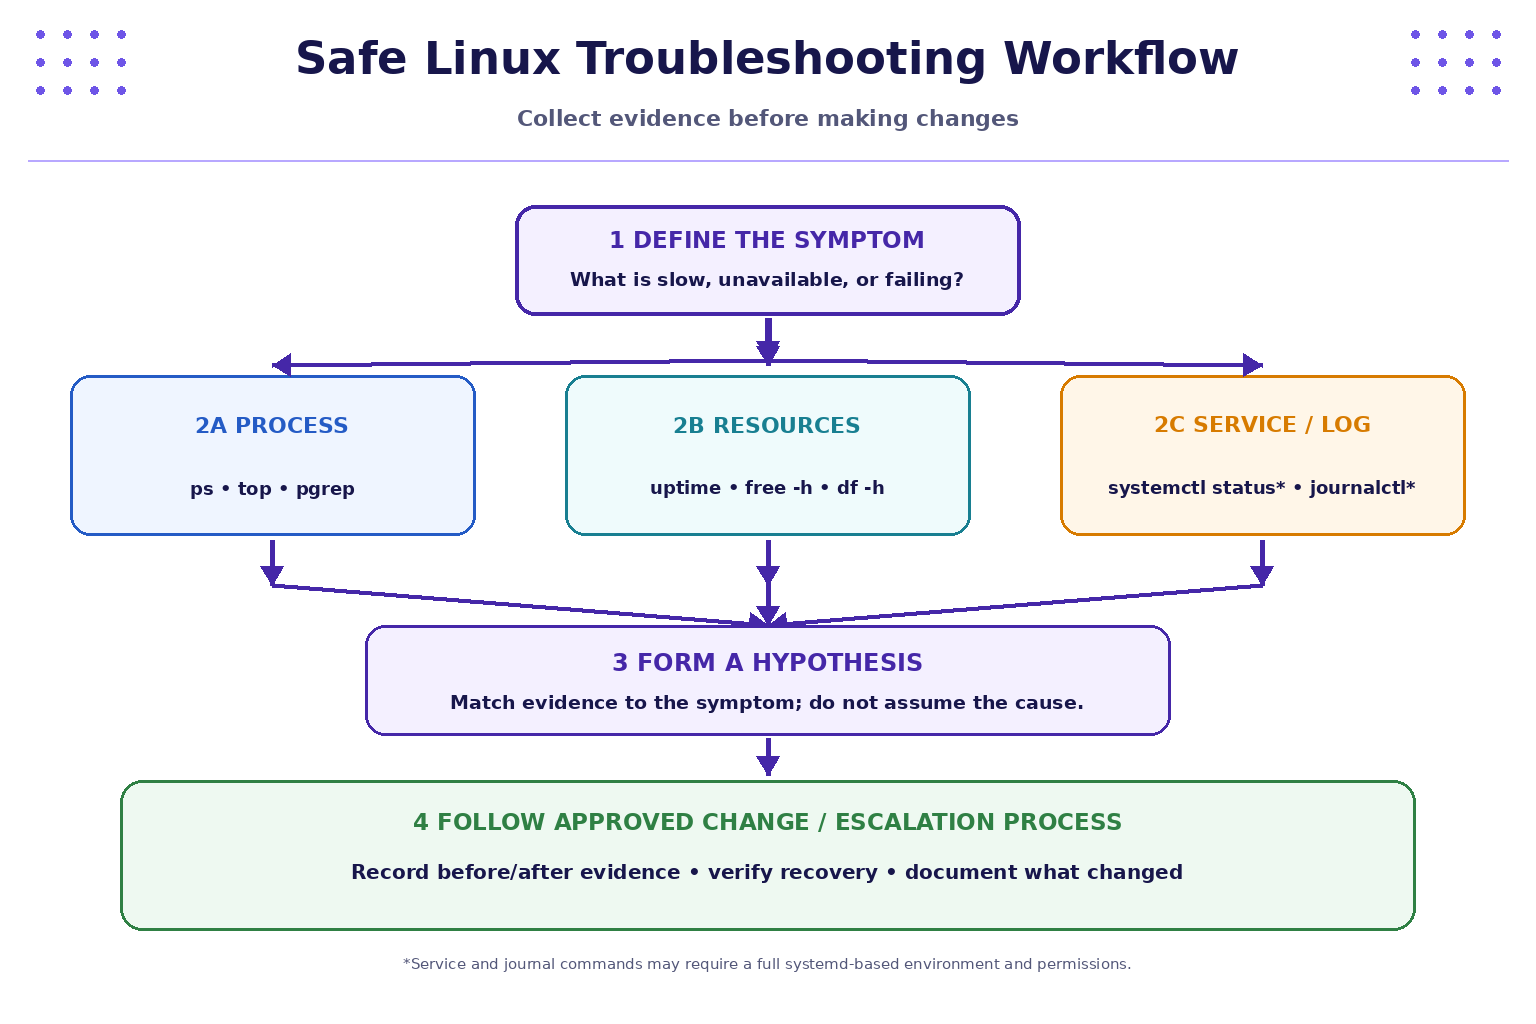
Use this structure when a service appears slow or unavailable:
- Define the symptom: what failed, when it began, who is affected, and whether it is reproducible.
- Collect evidence: process snapshot, memory and disk observations, relevant service status, and authorised logs.
- Form a hypothesis: link a possible cause to the evidence and state what is still unknown.
- Escalate or act through the approved process: do not restart, kill, delete, or reconfigure a service without authorisation.
- Verify: repeat the relevant observation and check whether the symptom has improved.
- Document: record timestamps, commands, outputs or summaries, action owner, and result.
A good incident note distinguishes observed facts from interpretation. For example, “filesystem / reports 96% used at 10:15” is an observation; “the application is slow because the disk is full” is a hypothesis that requires further evidence.
9. Practical lab C — mini performance investigation
Scenario: A fictional web application responds slowly. You have permission to inspect your own lab machine, but you are not authorised to change system services.
Run:
date
uptime
free -h
df -h
ps aux | head -n 15
Complete the worksheet:
| Field | Your notes |
|---|---|
| Symptom being investigated | |
| Time of observation | |
| Process-related evidence | |
| Memory-related evidence | |
| Filesystem-related evidence | |
| What the evidence supports | |
| What remains uncertain | |
| Safe next step / escalation |
Do not label a root cause unless the evidence supports it. If the environment is idle and the symptom cannot be reproduced, record that limitation rather than inventing a finding.
10. Troubleshooting and safe practice
pgrepfinds no process: it may not be running, the pattern may be wrong, or the environment may restrict process visibility.topis unavailable: usepsand available resource commands; browser terminals may provide a limited command set.systemctlsays the system was not booted with systemd: this can be normal in some WSL2 or container environments. Continue with other labs.journalctlshows no entries or permission errors: journal access depends on system configuration and privileges. Do not bypass controls.dfanddudisagree: they measure different things; open/deleted files, mount boundaries, permissions, and filesystem accounting can affect results.- High load average: interpret it alongside CPU count, process states, workload, and historical baseline.
- A process name is unfamiliar: investigate its command path, owner, parent, and expected role through authorised methods. Do not kill it based only on its name.
Safety rule: Use read-only observation first. Never terminate processes, restart production services, change resource limits, or delete logs without explicit authorisation and an approved operational plan.
11. Quick command recap
| Task | Command |
|---|---|
| Process snapshot | ps aux |
| First 10 rows of process output | ps aux | head |
| Interactive process monitor | top |
| Find process by pattern | pgrep -a bash |
| Show uptime/load averages | uptime |
| Show memory and swap | free -h |
| Show filesystem space | df -h |
| Estimate directory usage | du -sh ~/linux-lab |
| Check systemd availability | systemctl --version |
| Inspect a service (where supported) | systemctl status cron |
| Recent journal entries (where supported) | journalctl -b -n 20 |
| Manual page | man ps |
12. Knowledge check — MCQs
1. What does PID stand for?
A. Process Identification Directory
B. Process ID
C. Permission Information Data
D. Primary Interface Driver
2. Which command is designed for an interactive view of processes and resource use?
A. top
B. pwd
C. mkdir
D. touch
3. What does free -h show?
A. Free disk filenames
B. Memory usage in human-readable units
C. Only the current username
D. Service restart history
4. Why should load averages not be interpreted alone?
A. They are always zero on Linux
B. They must be considered alongside CPU count, workload, process states, and context
C. They show only filesystem capacity
D. They identify the exact root cause automatically
5. Why might systemctl not work in a browser terminal or some WSL2 setups?
A. Linux has no services
B. The environment may not be running systemd
C. It only works with text files
D. It requires Wireshark
6. What is the safest first response to an unfamiliar busy process?
A. Terminate it immediately
B. Delete its executable
C. Inspect its identity, command, and context, then follow the approved process
D. Disable system monitoring
Answers and explanations
- B — PID is the process identifier.
- A —
topprovides a live interactive process/resource view. - B —
-hrequests human-readable units for memory figures. - B — load averages need context and do not directly identify a root cause.
- B — some environments do not run a full systemd-based setup.
- C — gather evidence before proposing or taking action.
Key takeaways
- Processes are running program instances; PIDs identify them while they exist.
ps,top, andpgrephelp inspect processes.uptime,free,df, anddushow different aspects of system health.- Service and journal commands depend on the environment and permissions.
- A symptom is not a root cause; collect evidence and document uncertainty.
- Inspect first, follow approved procedures, verify the result, and preserve operational evidence.
Next chapter
Chapter 6: Software Installation, Package Management, and Updates — learn how Linux packages are installed, updated, queried, and maintained safely.