
Chapter 16: API Performance and Caching
In the previous chapter, we containerized our Insurance Policy Management System (IPMS) using Docker and deployed it on Kubernetes.
Our platform can now:
- Run in Containers
- Scale using Kubernetes
- Use ConfigMaps and Secrets
- Perform Rolling Updates
- Support Cloud-Native Deployments
However, another critical challenge remains.
How do we ensure APIs remain fast as the number of users grows?
How do we reduce database load?
How do we improve response times for frequently requested data?
Enterprise systems solve these challenges using:
Performance Optimization

Caching

Database Tuning

Connection Pooling
In this chapter, we will learn how to optimize API performance and implement caching strategies using Redis and Spring Boot.
🎯 Learning Objectives
By the end of this chapter, you will be able to:
- Understand API Performance Fundamentals
- Identify Performance Bottlenecks
- Understand Caching Concepts
- Implement Caching Strategies
- Use Redis as a Distributed Cache
- Configure Spring Boot Caching
- Optimize Database Performance
- Configure Connection Pooling
- Perform Performance Testing
- Design High-Performance APIs
Why API Performance Matters
Modern users expect APIs to respond quickly.
Consider a Policy Search API.
Customer Portal
      ↓
Policy API
      ↓
Database
If every request queries the database:
Higher Latency

Increased Database Load

Reduced Scalability
Poor performance impacts:
- User Experience
- Business Productivity
- Infrastructure Cost
- Customer Satisfaction
Performance Challenges in Insurance Systems
Common performance challenges include:
Large Policy Volumes

Complex Claims Queries

Premium Calculation Logic

External Service Calls

Database Bottlenecks
Without optimization:
Slow APIs

Timeouts

System Overload
API Performance Metrics
Performance is measured using:
Response Time

Latency

Throughput

Availability

Error Rate
Response Time
Time taken to complete a request.
Example:
Request Sent
      ↓
Response Received

250 ms
Throughput
Number of requests processed.
Example:
1000 Requests/Second
Latency
Delay before processing begins.
Lower latency improves user experience.
Availability
Percentage of uptime.
Example:
99.99%
API Performance Overview
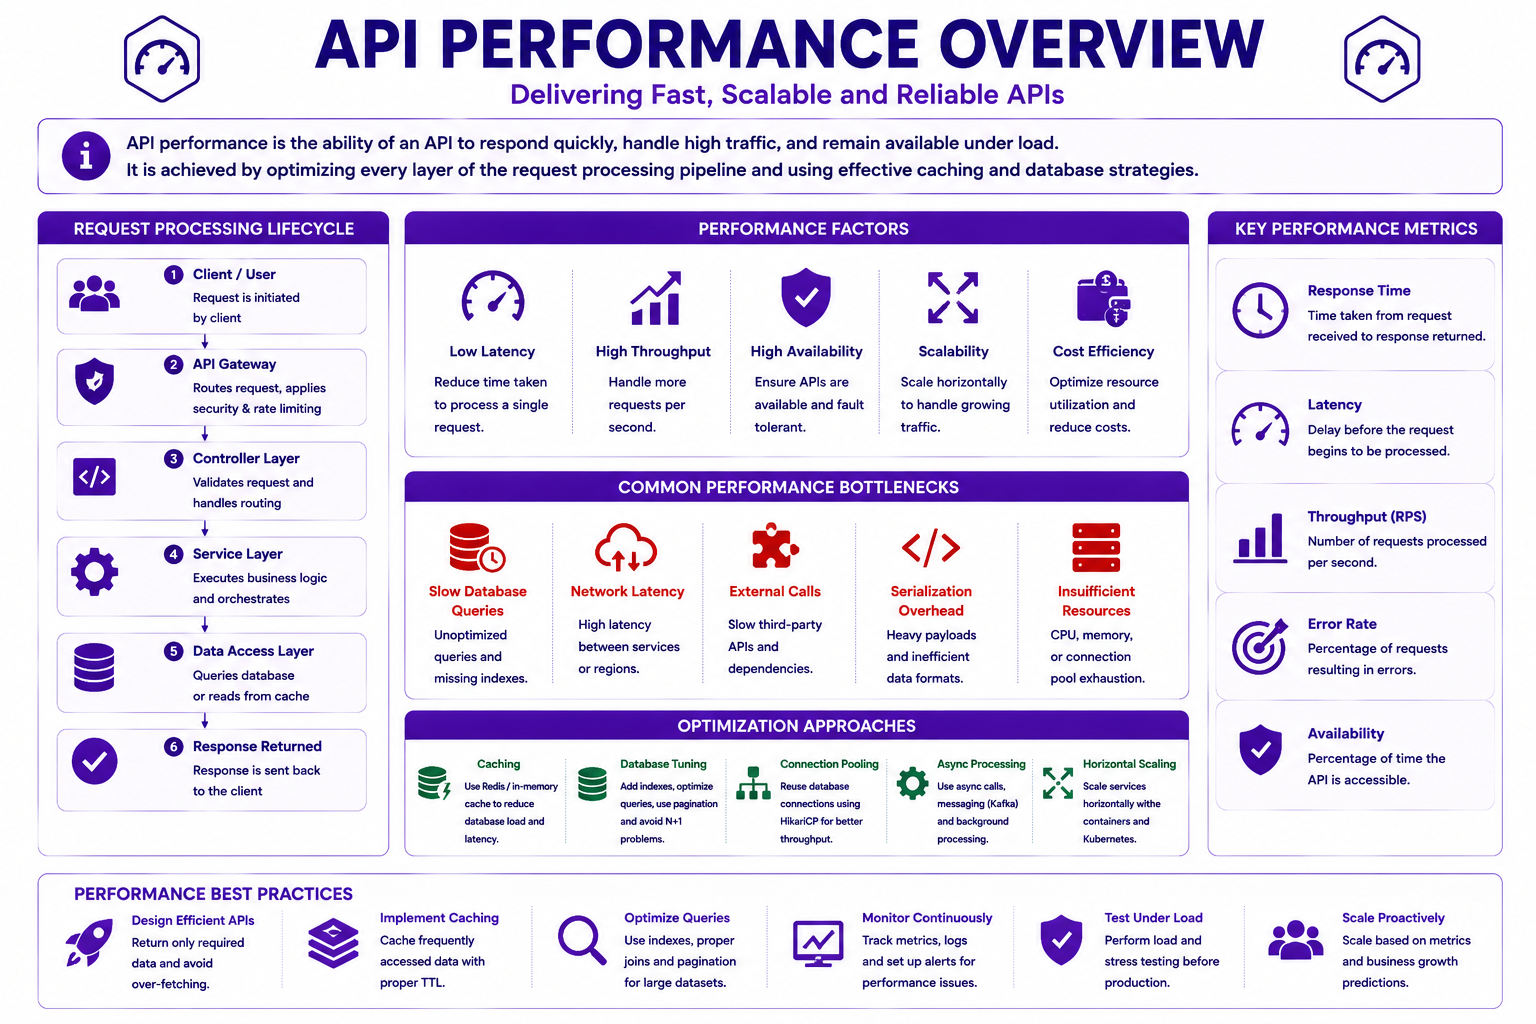
Performance optimization requires improvements across multiple layers.
Request Processing Lifecycle
Every request passes through several layers.
Client
   ↓
API Gateway
   ↓
Controller
   ↓
Service
   ↓
Database
Performance issues may occur at any layer.
Common Performance Bottlenecks
Typical bottlenecks include:
Slow Database Queries

Network Latency

External API Calls

Serialization Overhead

Insufficient Resources
Identifying bottlenecks is the first step toward optimization.
What is Caching?
Caching stores frequently used data in a faster storage layer.
Instead of:
API
 ↓
Database
we use:
API
 ↓
Cache
 ↓
Database
Frequently requested data is returned from cache.
Why Caching Works
Suppose a policy is requested thousands of times.
Without caching:
Every Request
      ↓
Database Query
With caching:
First Request
      ↓
Database

Subsequent Requests
      ↓
Cache
Result:
Faster Response

Reduced Database Load
Benefits of Caching
Caching provides:
Lower Latency

Higher Throughput

Improved Scalability

Reduced Database Load

Better User Experience
Caching Strategies
Caching can occur at multiple levels.
Caching Strategies Overview
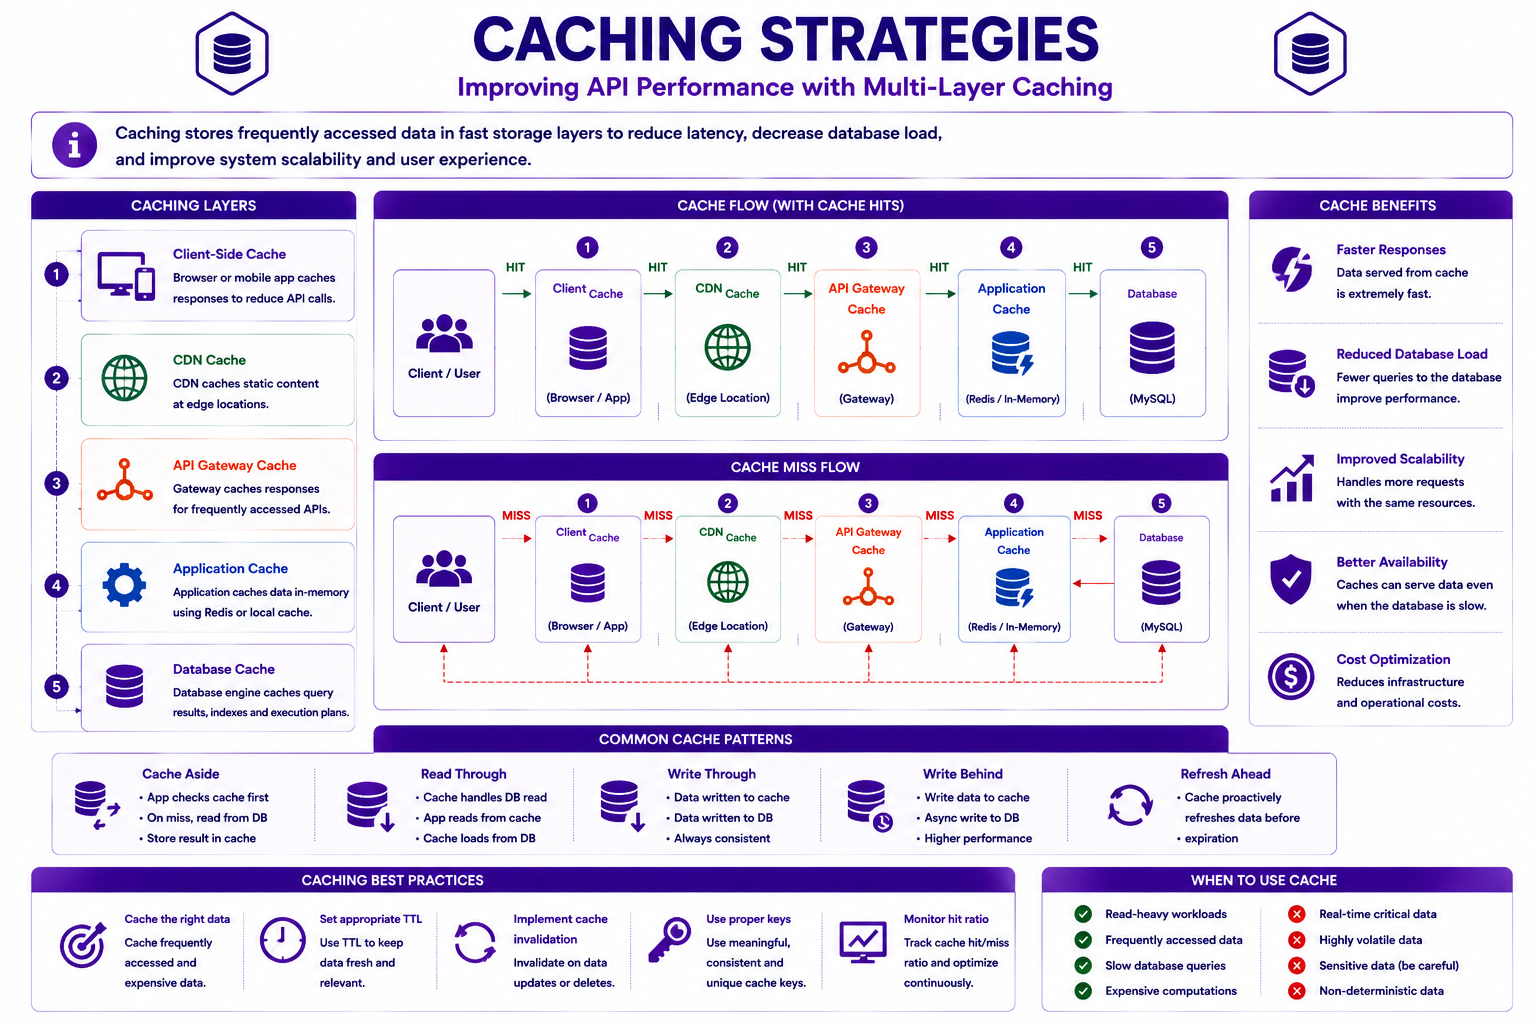
Different caching layers work together to improve performance.
Client-Side Caching
Browsers and mobile applications can cache responses.
Example:
Cache-Control: max-age=3600
Benefits:
Reduced Network Calls

Faster User Experience
CDN Caching
Static content can be cached at edge locations.
Examples:
Images

Documents

Reports

Static Assets
API Gateway Caching
Gateways can cache responses.
Example:
API Gateway
      ↓
Cache
      ↓
Backend Service
Repeated requests bypass backend processing.
Application Caching
Most enterprise applications implement application-level caching.
Examples:
Policy Details

Customer Information

Reference Data

Product Catalogs
Database Caching
Database engines also provide caching.
Examples:
Query Cache

Buffer Pool

Execution Plans
Cache Patterns
Enterprise systems use common cache patterns.
Cache Aside Pattern
Most popular approach.
Flow:
Request
   ↓
Cache Lookup

Cache Miss
   ↓
Database
   ↓
Update Cache
Applications manage cache explicitly.
Read Through Cache
Cache automatically loads data.
Application
      ↓
Cache
      ↓
Database
Write Through Cache
Data is written to:
Cache
  +
Database
simultaneously.
Write Behind Cache
Application updates cache first.
Database updates later asynchronously.
Refresh Ahead Cache
Cache proactively refreshes data before expiration.
Redis Fundamentals
Redis is the most popular distributed caching solution.
Redis stands for:
Remote Dictionary Server
Redis stores data in memory.
This makes Redis extremely fast.
Why Redis?
Redis provides:
High Performance

Distributed Caching

Scalability

Persistence Options

Multiple Data Structures
Redis Data Structures
Redis supports:
Strings

Lists

Hashes

Sets

Sorted Sets
Redis Architecture
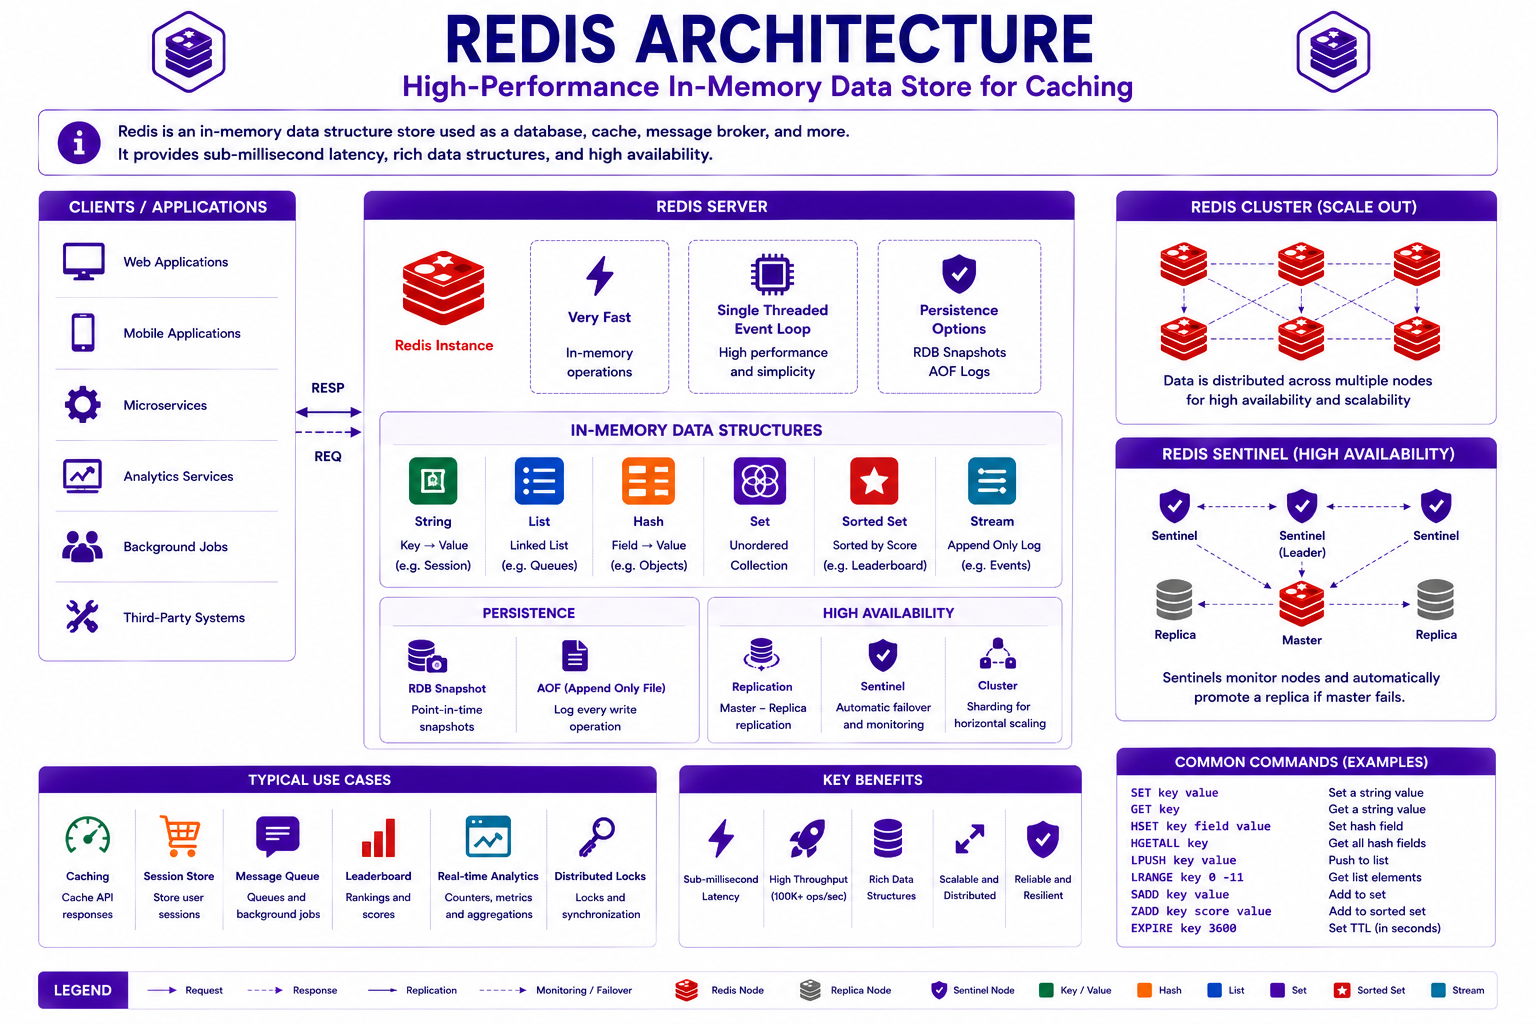
Redis acts as a high-speed cache between applications and databases.
Spring Boot Redis Integration
Spring Boot provides built-in Redis support.
Maven Dependency
<dependency>
    <groupId>
        org.springframework.boot
    </groupId>

    <artifactId>
        spring-boot-starter-data-redis
    </artifactId>
</dependency>
Redis Configuration
spring:
  data:
    redis:
      host: localhost
      port: 6379
Enabling Caching
@SpringBootApplication
@EnableCaching
public class Application {

}
Spring Cache Annotations
Spring provides several caching annotations.
@Cacheable
Stores data in cache.
@Cacheable("policies")
public PolicyResponse getPolicy(
        String policyNumber) {

}
First request:
Database Access
Subsequent requests:
Redis Cache
@CachePut
Updates cache after execution.
@CachePut("policies")
@CacheEvict
Removes cache entries.
@CacheEvict(
    value = "policies",
    key = "#policyNumber")
Used when policies are updated or deleted.
Policy API Caching Example
Example:
GET /api/policies/LIFE-100001
Flow:
Client
   ↓
Policy Service
   ↓
Redis Cache

Cache Miss
   ↓
Database
Database Optimization
Caching alone is not sufficient.
Databases must also be optimized.
Database Optimization Overview
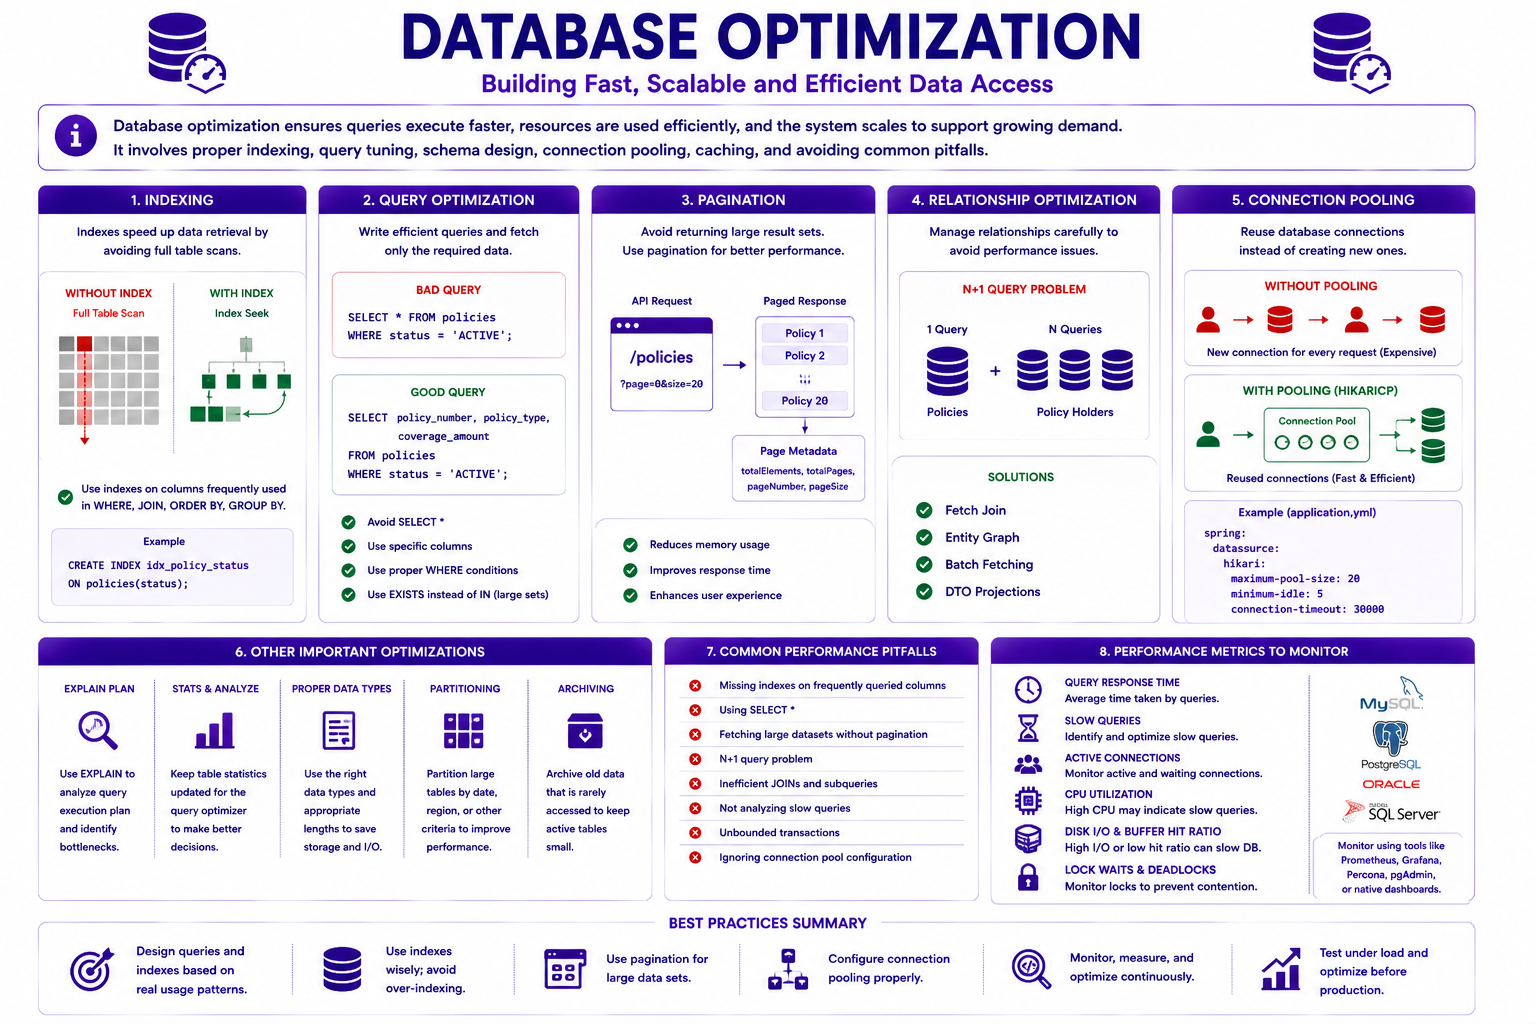
Proper indexing and query design significantly improve performance.
Database Indexing
Indexes improve query speed.
Without Index:
Full Table Scan
With Index:
Direct Lookup
Example
CREATE INDEX idx_policy_status
ON policies(status);
Queries execute faster.
Query Optimization
Poor queries cause slow APIs.
Bad:
SELECT *
FROM policies;
Good:
SELECT policy_number,
       status
FROM policies;
Retrieve only required columns.
Pagination
Avoid returning large datasets.
Bad:
GET /policies
Good:
GET /policies?page=0&size=20
Benefits:
Lower Memory Usage

Faster Responses
N+1 Query Problem
Common Hibernate performance issue.
Example:
1 Policy Query

100 Customer Queries
Result:
101 Queries
Solutions:
Fetch Join

Entity Graph

Batch Fetching
Connection Pooling
Creating database connections is expensive.
Connection pooling reuses connections.
HikariCP
Spring Boot's default connection pool.
Benefits:
Faster Database Access

Reduced Resource Usage

Improved Throughput
HikariCP Configuration
spring:
  datasource:
    hikari:
      maximum-pool-size: 20
      minimum-idle: 5
Performance Testing
Optimization should be validated using testing.
Types of Performance Testing
Load Testing
Expected workload.
Example:
1000 Users
Stress Testing
Beyond normal capacity.
Example:
5000 Users
Spike Testing
Sudden traffic increases.
Example:
Black Friday

Insurance Campaign Launch
Endurance Testing
Long-duration testing.
Example:
24 Hours Continuous Load
Performance Testing Tools
Common tools include:
Apache JMeter

Gatling

k6
Monitoring Performance
Performance should be continuously monitored.
Key metrics:
Response Time

Cache Hit Ratio

Database Query Time

CPU Usage

Memory Usage
IPMS Performance Architecture
A high-performance Insurance Policy Management System uses:
API Gateway
      ↓
Policy Service
      ↓
Redis Cache
      ↓
MySQL Database

Kafka Events
IPMS Performance Architecture
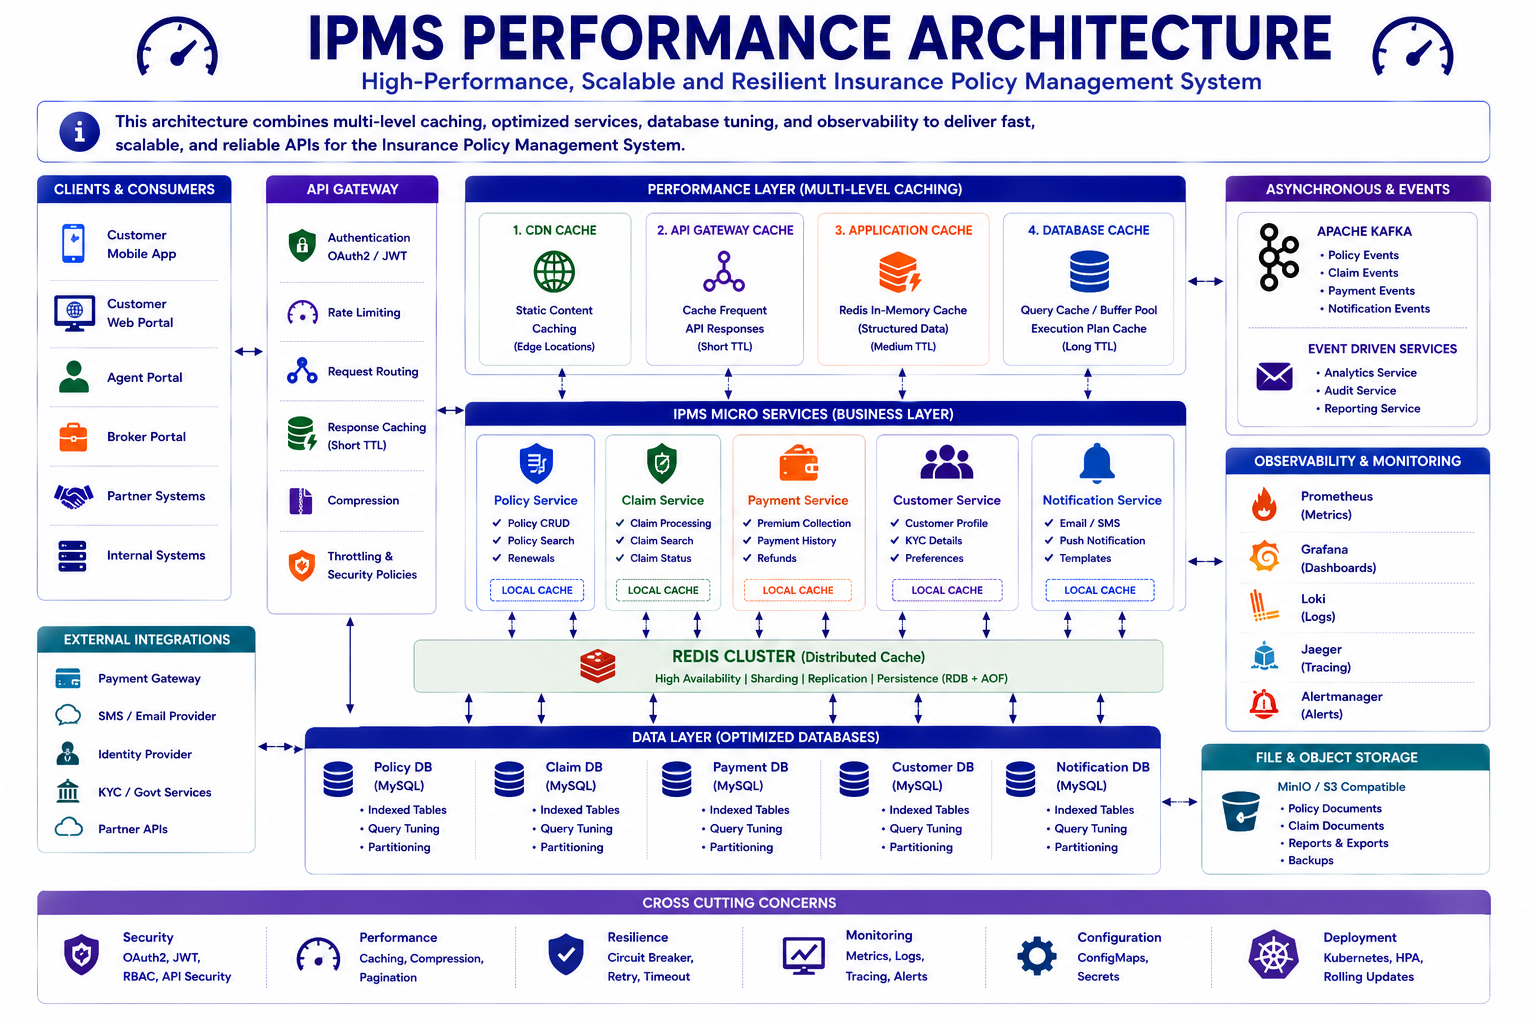
Caching and database optimization significantly improve scalability.
Best Practices
✅ Cache frequently accessed data
✅ Use Redis for distributed caching
✅ Implement pagination
✅ Optimize database queries
✅ Use indexes appropriately
✅ Configure connection pools
✅ Load test before production
✅ Monitor cache hit ratios
Common Mistakes
❌ Caching everything
❌ Ignoring cache invalidation
❌ Missing database indexes
❌ Returning huge result sets
❌ Using SELECT *
❌ No performance testing
❌ Ignoring slow query logs
Interview Questions
-
What is caching?
-
Why is Redis used?
-
What is Cache Aside Pattern?
-
Difference between Redis and Database?
-
What is connection pooling?
-
What is HikariCP?
-
What is the N+1 Query Problem?
-
Why are indexes important?
-
How do you optimize API performance?
-
What metrics indicate API health?
Practice Exercises
-
Configure Redis in Spring Boot.
-
Cache Policy API responses.
-
Implement cache eviction.
-
Create database indexes.
-
Configure HikariCP.
-
Optimize a slow query.
-
Load test the Policy API.
-
Measure cache hit ratio.
Key Takeaways
- API performance directly impacts user experience.
- Caching reduces latency and database load.
- Redis is a popular distributed caching solution.
- Spring Boot provides built-in caching support.
- Database optimization improves scalability.
- HikariCP improves database connectivity performance.
- Load testing validates production readiness.
- Continuous monitoring ensures long-term performance.
Chapter Summary
In this chapter, you learned:
- API Performance Fundamentals
- Performance Metrics
- Caching Strategies
- Cache Patterns
- Redis Fundamentals
- Spring Boot Caching
- Database Optimization
- Connection Pooling
- Performance Testing
- Monitoring Metrics
Our Insurance Policy Management System can now deliver fast and scalable APIs.
In the next chapter, we will focus on Observability, Structured Logging, Distributed Tracing, Metrics Collection, Prometheus, Grafana, and Production Monitoring.