
Chapter 17: Observability, Logging and Monitoring
In the previous chapter, we optimized our Insurance Policy Management System (IPMS) for performance using caching, Redis, database tuning, and connection pooling.
Our APIs are now:
- Faster
- More Scalable
- Better Optimized
However, operating enterprise systems in production introduces another challenge.
How do we know when something goes wrong?
How do we identify slow APIs?
How do we troubleshoot failures across multiple microservices?
How do we monitor system health in real time?
This is where observability becomes critical.
Modern cloud-native applications rely on:
Logging

Metrics

Tracing

Monitoring

Alerting
to gain visibility into system behavior.
In this chapter, we will learn how to implement observability using structured logging, distributed tracing, Prometheus, Grafana, and modern monitoring practices.
🎯 Learning Objectives
By the end of this chapter, you will be able to:
- Understand Observability Fundamentals
- Implement Structured Logging
- Use Correlation IDs
- Understand Distributed Tracing
- Monitor APIs using Metrics
- Configure Prometheus
- Create Grafana Dashboards
- Implement Health Checks
- Monitor Microservices Effectively
- Design an Observable IPMS Platform
Why Observability Matters
Consider the following scenario.
A customer reports:
Unable to Submit Claim
The request passes through:
API Gateway
      ↓
Claim Service
      ↓
Policy Service
      ↓
Payment Service
      ↓
Database
Where did the failure occur?
Without observability:
Difficult Troubleshooting

Long Resolution Times

Poor User Experience
With observability:
Quick Root Cause Analysis

Faster Recovery

Better Reliability
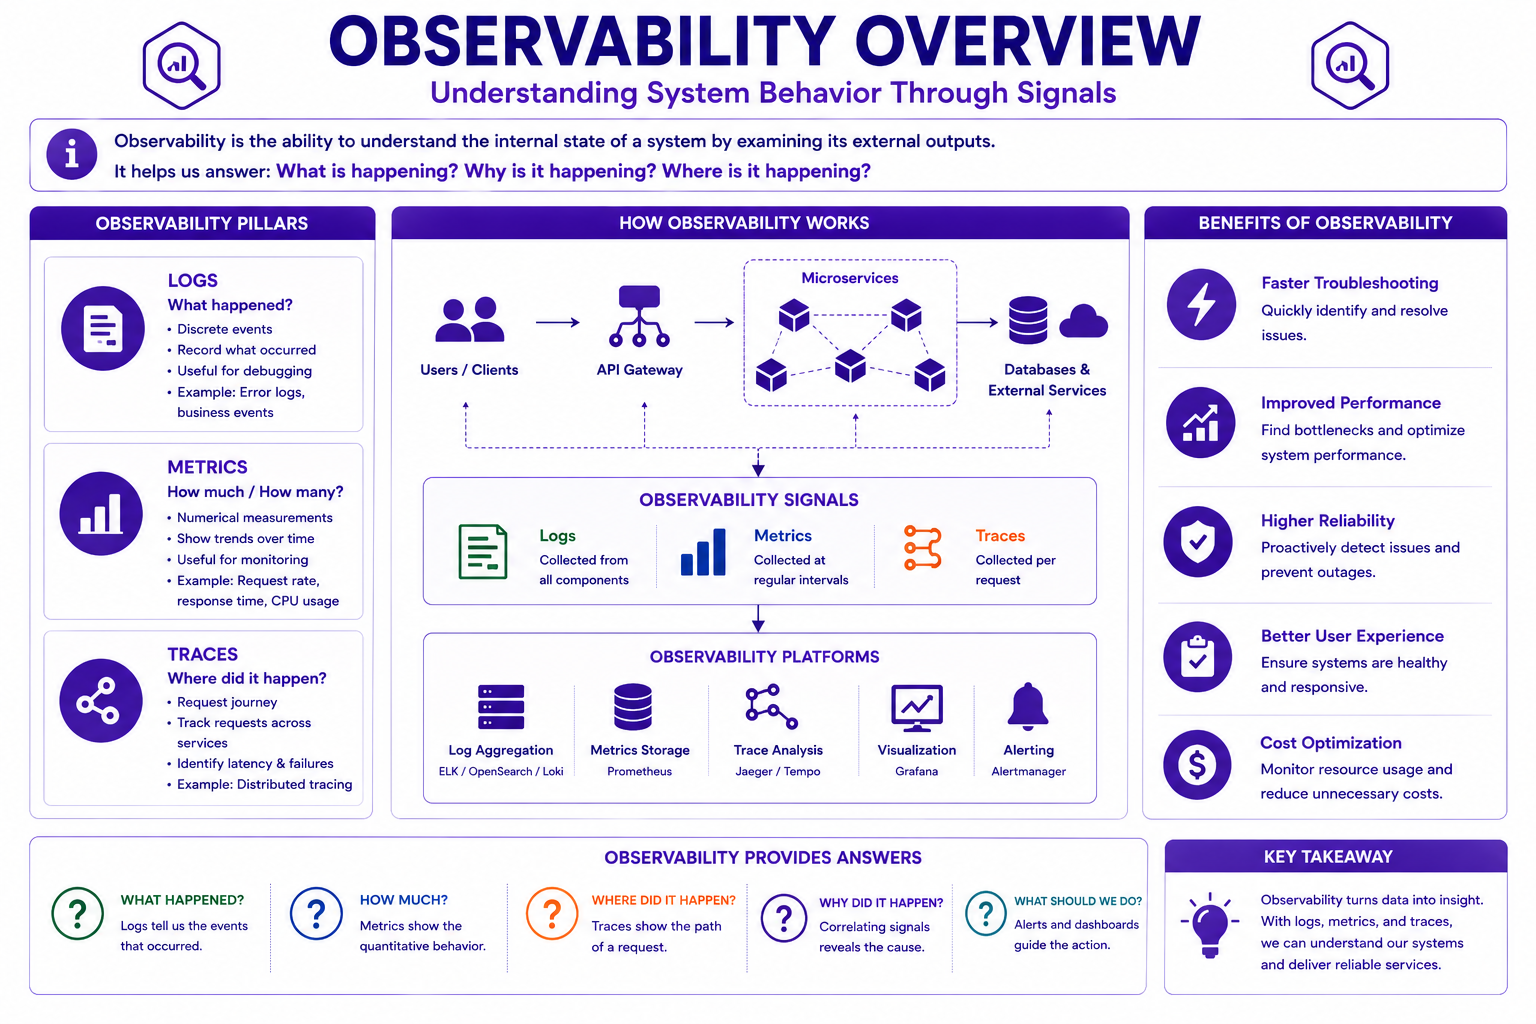
What is Observability?
Observability is the ability to understand the internal state of a system using external outputs.
These outputs typically include:
Logs

Metrics

Traces
Together they provide complete visibility into application behavior.
Three Pillars of Observability
Logs
      ↓
Metrics
      ↓
Traces
Each pillar answers different questions.
| Pillar | Answers |
|---|---|
| Logs | What happened? |
| Metrics | How much? |
| Traces | Where did it happen? |
Observability Overview
Understanding Logs
Logs capture application events.
Example:
Policy Created

Claim Submitted

Payment Failed

Authentication Error
Logs help developers understand system behavior.
Traditional Logging Problems
Typical logs:
2025-06-15 Created Policy
Problems:
Difficult Searching

No Context

Poor Analysis
Enterprise systems use structured logging.
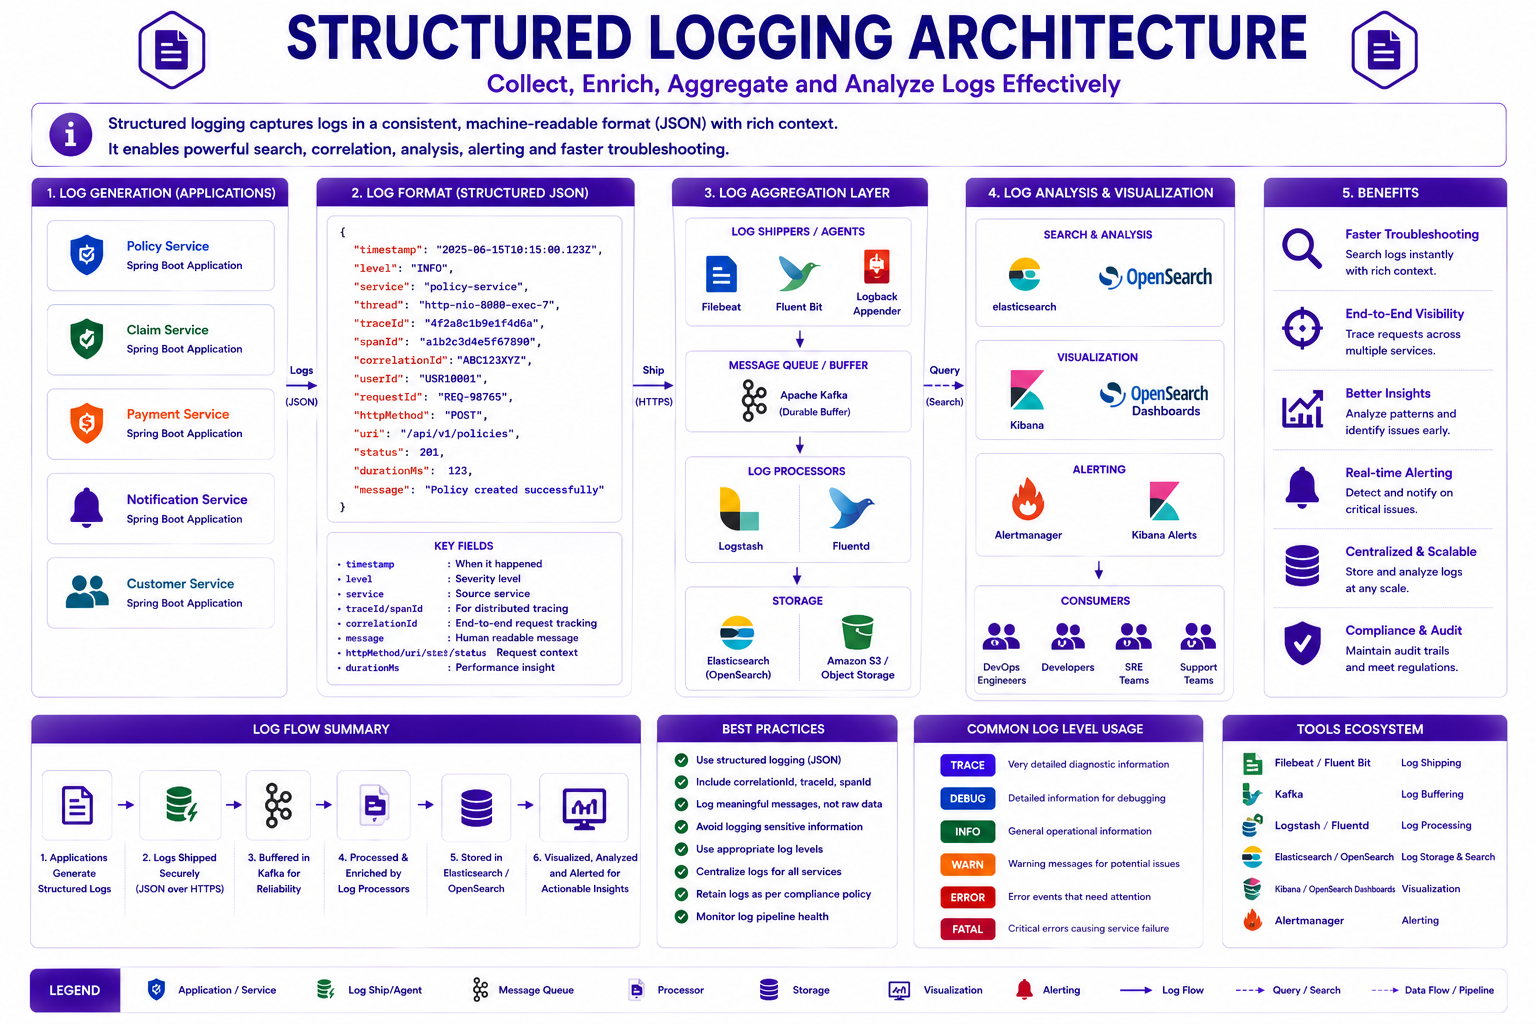
Structured Logging
Structured logs use JSON format.
Example:
{
  "timestamp": "2025-06-15T10:15:00",
  "level": "INFO",
  "service": "policy-service",
  "policyNumber": "LIFE-100001",
  "message": "Policy Created"
}
Benefits:
Searchable

Machine Readable

Analytics Friendly
Logging Levels
Common logging levels:
TRACE

DEBUG

INFO

WARN

ERROR
TRACE
Detailed diagnostic information.
DEBUG
Developer troubleshooting information.
INFO
Normal business operations.
Example:
Policy Created
WARN
Potential issues.
Example:
Payment Retry Initiated
ERROR
Application failures.
Example:
Database Connection Failed
Correlation IDs
In microservices, one request may span multiple services.
Example:
Gateway
   ↓
Policy Service
   ↓
Claim Service
   ↓
Notification Service
A Correlation ID tracks the request.
Example:
X-Correlation-ID:
ABC123XYZ
Every service logs the same identifier.
Structured Logging Architecture
Spring Boot Logging
Default logging framework:
Logback
Example:
private static final Logger logger =
LoggerFactory.getLogger(
PolicyService.class);

logger.info(
"Policy created: {}",
policyNumber);
Log Aggregation
In production, logs are collected centrally.
Example:
Policy Service
Claim Service
Payment Service
Notification Service
send logs to:
Central Logging Platform
Examples:
ELK Stack

OpenSearch

Loki
Understanding Distributed Tracing
Tracing follows a request as it moves through services.
Example:
Customer Request
      ↓
Gateway
      ↓
Policy Service
      ↓
Claim Service
      ↓
Database
A trace records every step.
Trace Components
Trace
Entire request journey.
Span
Individual operation.
Example:
Gateway Call

Database Query

Kafka Publish
Parent Span
Originating operation.
Child Span
Nested operation.
Distributed Tracing Architecture
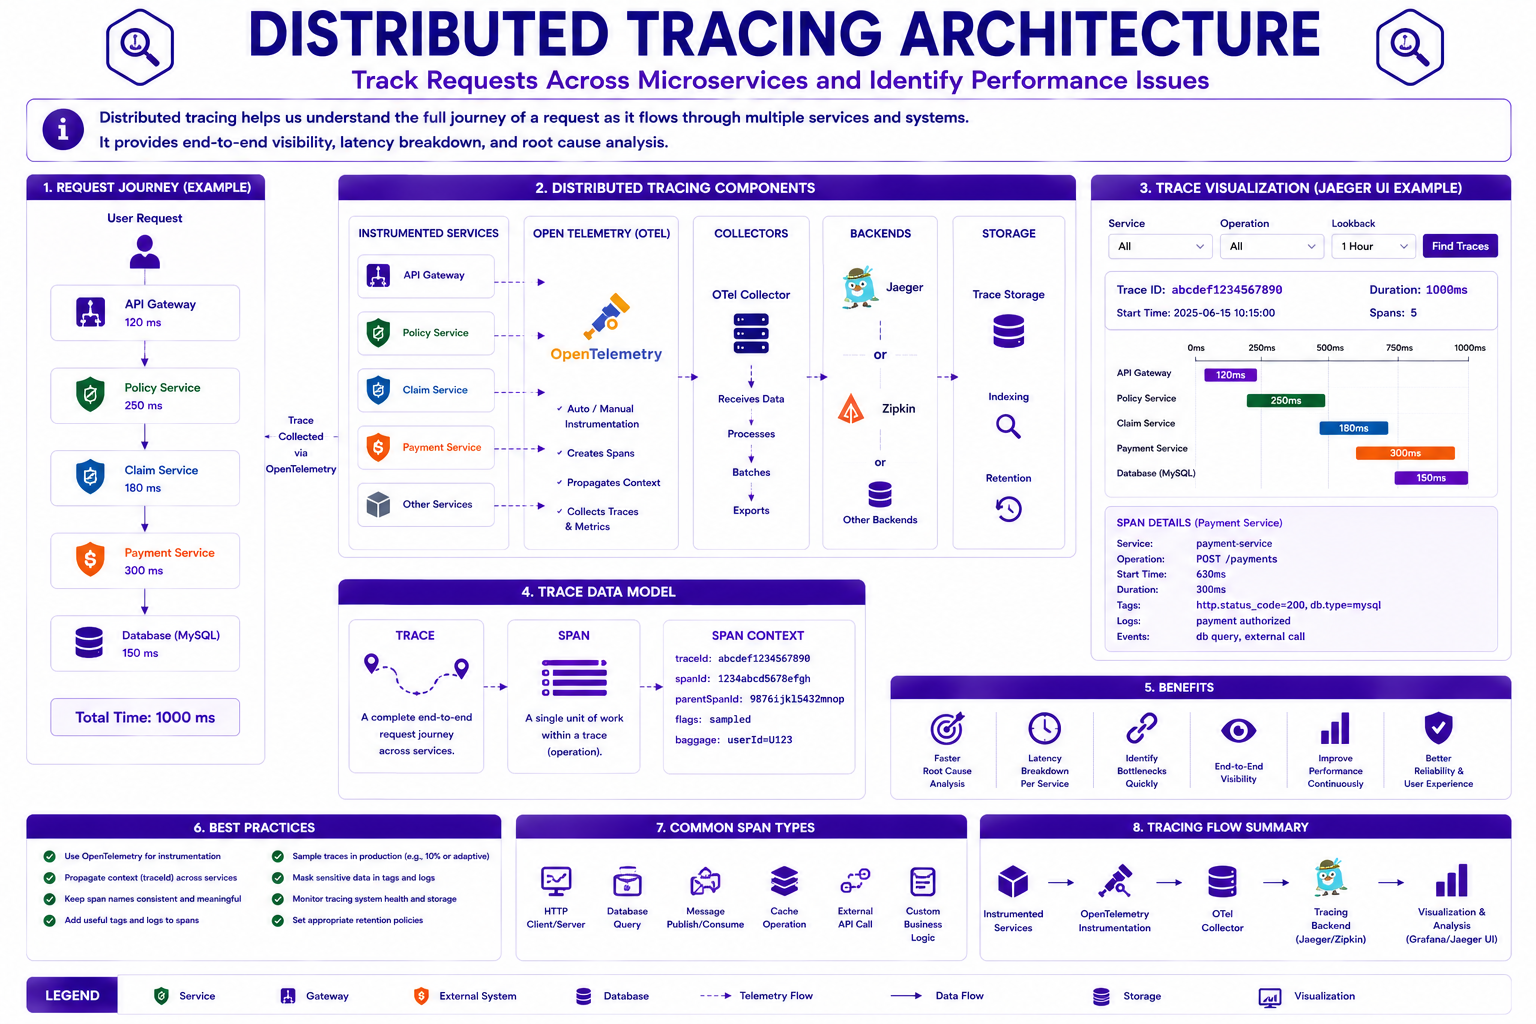
OpenTelemetry
OpenTelemetry is the industry standard for observability.
Provides:
Tracing

Metrics

Logs
Benefits:
Vendor Neutral

Cloud Native

Open Standard
Jaeger
Jaeger visualizes traces.
Example:
Request Duration

Slow Service

Database Latency
Benefits:
Root Cause Analysis

Performance Optimization
Understanding Metrics
Metrics provide numerical measurements.
Examples:
Request Count

Error Rate

Response Time

CPU Usage

Memory Usage
Metrics help identify trends and anomalies.
Application Metrics
Spring Boot provides metrics through:
Spring Boot Actuator
Example endpoint:
/actuator/metrics
Health Checks
Health checks indicate application status.
Example:
/actuator/health
Response:
{
  "status": "UP"
}
Types of Health Checks
Liveness Check
Determines if application is alive.
Readiness Check
Determines if application can accept traffic.
Startup Check
Determines successful startup.
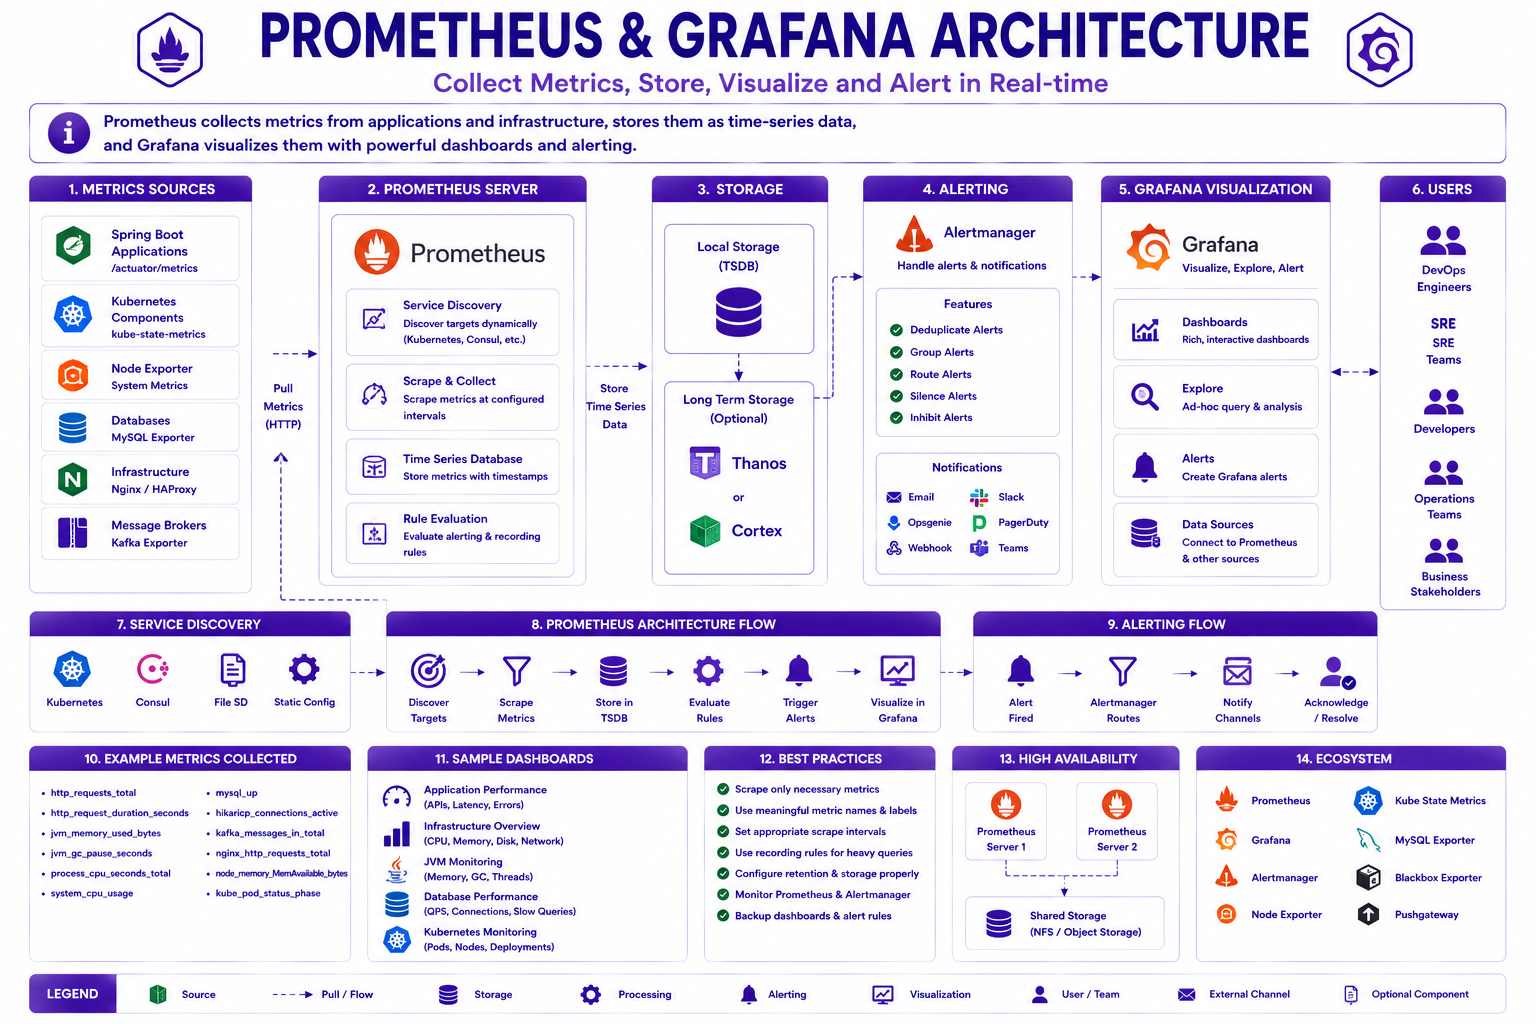
Prometheus
Prometheus collects metrics from applications.
Flow:
Application
      ↓
Metrics Endpoint
      ↓
Prometheus
Prometheus stores time-series data.
Prometheus Metrics Examples
http_requests_total

jvm_memory_used_bytes

system_cpu_usage

hikaricp_connections
Grafana
Grafana visualizes metrics.
Provides:
Dashboards

Charts

Alerts
Common dashboards:
API Performance

JVM Metrics

Database Metrics

System Metrics
Prometheus-Grafana Architecture
Alerting
Monitoring without alerting is incomplete.
Examples:
High CPU Usage

High Error Rate

Slow Response Time

Database Failure
Alerts notify operations teams immediately.
Golden Signals
Google SRE identifies four key signals.
Latency
Request processing time.
Traffic
Request volume.
Errors
Failed requests.
Saturation
Resource utilization.
Monitoring Dashboards
A production dashboard should include:
API Response Time

Request Rate

Error Rate

CPU Usage

Memory Usage

Database Performance

Cache Hit Ratio
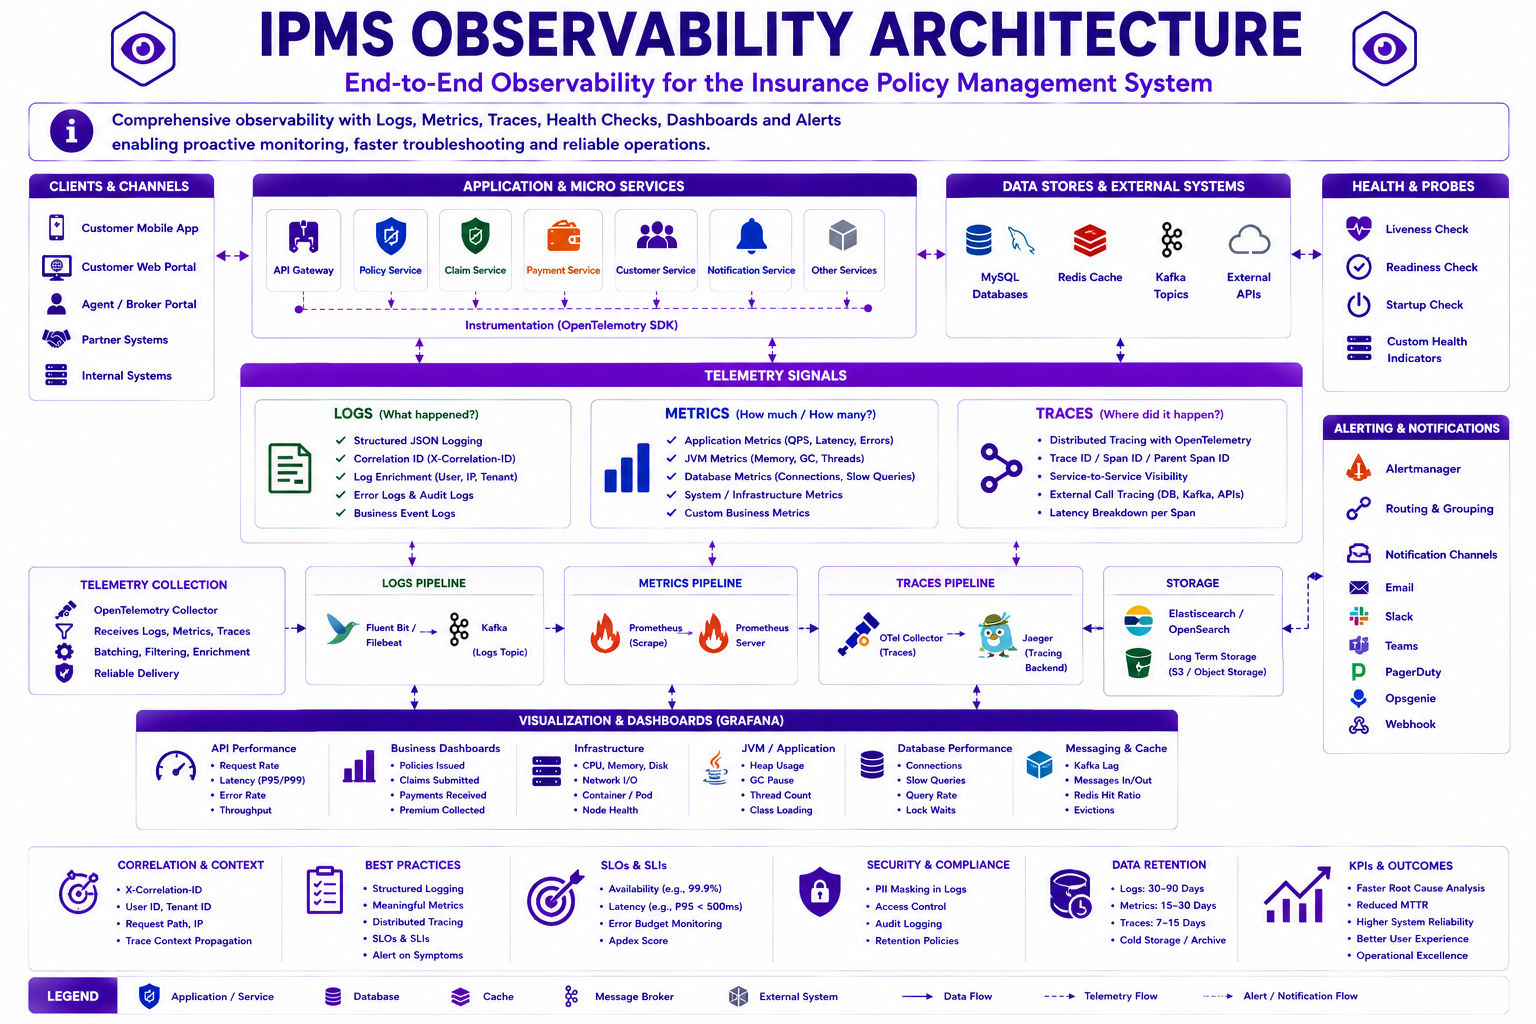
IPMS Observability Architecture
The complete observability solution for IPMS includes:
Logs
Metrics
Traces
Dashboards
Alerts
across all services.
IPMS Observability Architecture
Best Practices
✅ Use structured JSON logging
✅ Implement correlation IDs
✅ Collect application metrics
✅ Monitor health endpoints
✅ Use distributed tracing
✅ Create actionable dashboards
✅ Configure alerts
✅ Monitor business metrics
Common Mistakes
❌ Logging sensitive information
❌ Excessive DEBUG logging
❌ No centralized logging
❌ Ignoring trace data
❌ Monitoring only infrastructure
❌ Missing alert thresholds
❌ No health checks
Interview Questions
-
What is observability?
-
What are the three pillars of observability?
-
What is structured logging?
-
What is a correlation ID?
-
What is distributed tracing?
-
What is OpenTelemetry?
-
What is Jaeger?
-
What is Prometheus?
-
What is Grafana?
-
Difference between monitoring and observability?
-
What are health checks?
-
What are Golden Signals?
Practice Exercises
-
Enable Spring Boot Actuator.
-
Configure structured logging.
-
Add correlation IDs.
-
Implement OpenTelemetry tracing.
-
Configure Prometheus scraping.
-
Create Grafana dashboards.
-
Configure alerts for high error rates.
-
Monitor JVM metrics.
Key Takeaways
- Observability provides visibility into system behavior.
- Logs, Metrics, and Traces form the three pillars of observability.
- Structured logging improves troubleshooting.
- Correlation IDs track requests across services.
- Distributed tracing visualizes request journeys.
- Prometheus collects metrics.
- Grafana visualizes operational data.
- Health checks improve reliability.
- Monitoring and alerting enable proactive operations.
Chapter Summary
In this chapter, you learned:
- Observability Fundamentals
- Structured Logging
- Correlation IDs
- Distributed Tracing
- OpenTelemetry
- Jaeger
- Metrics Collection
- Prometheus
- Grafana
- Health Checks
- Alerting and Monitoring
Our Insurance Policy Management System is now observable, measurable, and production-ready.
In the next chapter, we will focus on API Governance, Enterprise Standards, Lifecycle Management, Security Governance, Version Governance, and Enterprise API Review Processes.