
Chapter 12: Dimensional Modeling
In the previous chapter, we explored historical data modeling and learned how to track data changes over time using Slowly Changing Dimensions and effective dating strategies.
In this chapter, we will dive into Dimensional Modeling—understanding the Kimball methodology, fact and dimension tables, and how to design star schemas for analytics.
Using our Digital Banking Platform case study, we will design dimensional models that support business intelligence, reporting, and analytics at enterprise scale.
🎯 Learning Objectives
By the end of this chapter, you will be able to:
- Understand dimensional modeling and its purpose
- Differentiate between fact and dimension tables
- Apply the Kimball methodology
- Design star schemas for analytics
- Identify fact types and grain
- Implement dimension hierarchies
- Understand slowly changing dimensions in context
- Design banking dimensional models
What is Dimensional Modeling?
Dimensional modeling is a data modeling technique designed for analytical queries and business intelligence.
Dimensional Modeling = Facts (Measures) + Dimensions (Context)
                     + Star Schema Design
                     + Optimized for Queries
Think of dimensional modeling as:
- A way to organize data for analysis
- Making data easy to understand
- Optimizing for query performance
- Supporting business decision-making
Real-World Banking Example
A bank needs to analyze transaction data for business intelligence:
Business Questions:
- What is the total transaction volume by branch?
- Which customer segment has the highest spending?
- What are the monthly trends in loan applications?
- Which products are most popular with customers?

Traditional (Normalized) Approach:
- Complex queries with multiple joins
- Slow performance on large datasets
- Difficult for business users

Dimensional Approach:
- Simple, intuitive structure
- Fast query performance
- Business-friendly design
- Easy to understand and use
Kimball Methodology
What is Kimball Methodology?
Kimball methodology is a bottom-up approach to data warehousing that focuses on dimensional modeling and business processes.
Kimball Approach = Business Process Focus
                 + Dimensional Modeling
                 + Star Schemas
                 + Incremental Development
Key Principles
1. Focus on Business Processes
   - Identify core business processes
   - Model each process as a fact table
   - Add dimensions for context

2. Use Star Schemas
   - Central fact table
   - Surrounding dimension tables
   - Denormalized dimensions

3. Develop Incrementally
   - Start with one business process
   - Build iteratively
   - Add more processes over time

4. Prioritize Usability
   - Make data easy to understand
   - Use business terminology
   - Ensure query performance
Kimball Lifecycle
1. Business Requirements Definition
   - Understand business needs
   - Identify key metrics
   - Define analytical questions

2. Dimensional Modeling Design
   - Identify fact tables
   - Define dimensions
   - Design star schemas

3. ETL/ELT Development
   - Extract from sources
   - Transform data
   - Load into star schemas

4. BI and Reporting
   - Create dashboards
   - Build reports
   - Enable self-service

5. Maintenance and Evolution
   - Monitor performance
   - Add new data sources
   - Refine models
Fact Tables
What is a Fact Table?
A fact table contains quantitative measures (facts) about a business process.
Fact Table = Business Events + Measures + Foreign Keys
Fact Table Characteristics
- Contains numeric measures (e.g., amounts, counts)
- Foreign keys to dimension tables
- Usually large (millions to billions of rows)
- Grain is the level of detail
- Additive, semi-additive, or non-additive facts
Fact Types
| Fact Type | Description | Banking Example |
|---|---|---|
| Transaction Fact | Captures individual events | ATM withdrawals |
| Periodic Snapshot | Captures state at intervals | Monthly account balances |
| Accumulating Snapshot | Captures processes over time | Loan origination lifecycle |
| Factless Fact | Captures events without measures | Customer-product enrollment |
Fact Grain
Grain defines the level of detail in a fact table.

Grain Examples:
- Transaction Level: One row per transaction
- Daily Level: One row per day per customer
- Monthly Level: One row per month per account

Banking Example:
- Transaction Fact: One row per transaction
- Daily Account Snapshot: One row per account per day
- Monthly Branch Summary: One row per branch per month
Fact Table Example
-- Transaction Fact Table
CREATE OR REPLACE TABLE banking.fact_transactions (
  -- Foreign Keys to Dimensions
  transaction_sk STRING PRIMARY KEY,
  date_sk STRING,                    -- To Date Dimension
  customer_sk STRING,                -- To Customer Dimension
  account_sk STRING,                 -- To Account Dimension
  branch_sk STRING,                  -- To Branch Dimension
  merchant_sk STRING,                -- To Merchant Dimension

  -- Measures (Facts)
  transaction_amount NUMERIC,
  fee_amount NUMERIC,
  tax_amount NUMERIC,
  transaction_count INT DEFAULT 1,

  -- Degenerate Dimension
  transaction_id STRING,

  -- Metadata
  created_at TIMESTAMP
)
PARTITION BY date_sk
CLUSTER BY customer_sk, account_sk;
Dimension Tables
What is a Dimension Table?
A dimension table provides context and attributes for the measures in fact tables.
Dimension Table = Attributes + Descriptions + Hierarchies
Dimension Table Characteristics
- Contains descriptive attributes
- Relatively small (thousands to millions)
- Slowly changing over time
- Used for filtering, grouping, and labeling
- Denormalized for performance
Common Dimensions
| Dimension | Description | Banking Example |
|---|---|---|
| Date | Time attributes | Year, Quarter, Month, Day |
| Time | Time of day | Hour, Minute, AM/PM |
| Customer | Customer attributes | Name, Segment, Location |
| Account | Account attributes | Type, Status, Open Date |
| Branch | Branch attributes | Name, Region, Manager |
| Product | Product attributes | Type, Category, Price |
| Merchant | Merchant attributes | Name, Category, Location |
Dimension Table Example
-- Customer Dimension Table
CREATE OR REPLACE TABLE banking.dim_customer (
  customer_sk STRING PRIMARY KEY,   -- Surrogate key
  customer_id STRING,               -- Natural key

  -- Attributes
  first_name STRING,
  last_name STRING,
  email STRING,
  phone STRING,
  date_of_birth DATE,
  age INT,
  gender STRING,
  marital_status STRING,

  -- Hierarchies
  country STRING,
  region STRING,
  city STRING,
  postal_code STRING,

  -- Segments
  customer_segment STRING,
  risk_profile STRING,

  -- SCD Type 2
  valid_from DATE,
  valid_to DATE,
  is_current BOOLEAN,

  -- Metadata
  created_at TIMESTAMP,
  updated_at TIMESTAMP
)
CLUSTER BY customer_id, customer_segment;
Star Schema
What is a Star Schema?
A star schema is a dimensional model with a central fact table and surrounding dimension tables.
Star Schema = Central Fact Table + Surrounding Dimensions
Star Schema Characteristics
- One fact table in the center
- Multiple dimension tables around it
- Dimension tables are denormalized
- Simple query structure
- High performance for analytics
- Easy for business users to understand
Star Schema Example
-- Star Schema for Banking Transactions
-- Central Fact Table
CREATE OR REPLACE TABLE banking.fact_transactions (
  transaction_sk STRING PRIMARY KEY,
  date_sk STRING,
  customer_sk STRING,
  account_sk STRING,
  branch_sk STRING,
  merchant_sk STRING,
  transaction_amount NUMERIC,
  fee_amount NUMERIC,
  transaction_count INT
);

-- Surrounding Dimension Tables
CREATE OR REPLACE TABLE banking.dim_date (
  date_sk STRING PRIMARY KEY,
  full_date DATE,
  year INT,
  quarter INT,
  month INT,
  month_name STRING,
  day INT,
  day_name STRING,
  day_of_week INT,
  is_weekend BOOLEAN,
  is_holiday BOOLEAN
);

CREATE OR REPLACE TABLE banking.dim_customer (
  customer_sk STRING PRIMARY KEY,
  customer_id STRING,
  first_name STRING,
  last_name STRING,
  email STRING,
  customer_segment STRING,
  risk_profile STRING
);

CREATE OR REPLACE TABLE banking.dim_account (
  account_sk STRING PRIMARY KEY,
  account_id STRING,
  account_type STRING,
  account_status STRING,
  open_date DATE
);

CREATE OR REPLACE TABLE banking.dim_branch (
  branch_sk STRING PRIMARY KEY,
  branch_id STRING,
  branch_name STRING,
  region STRING,
  city STRING,
  state STRING
);

CREATE OR REPLACE TABLE banking.dim_merchant (
  merchant_sk STRING PRIMARY KEY,
  merchant_id STRING,
  merchant_name STRING,
  merchant_category STRING,
  merchant_type STRING
);
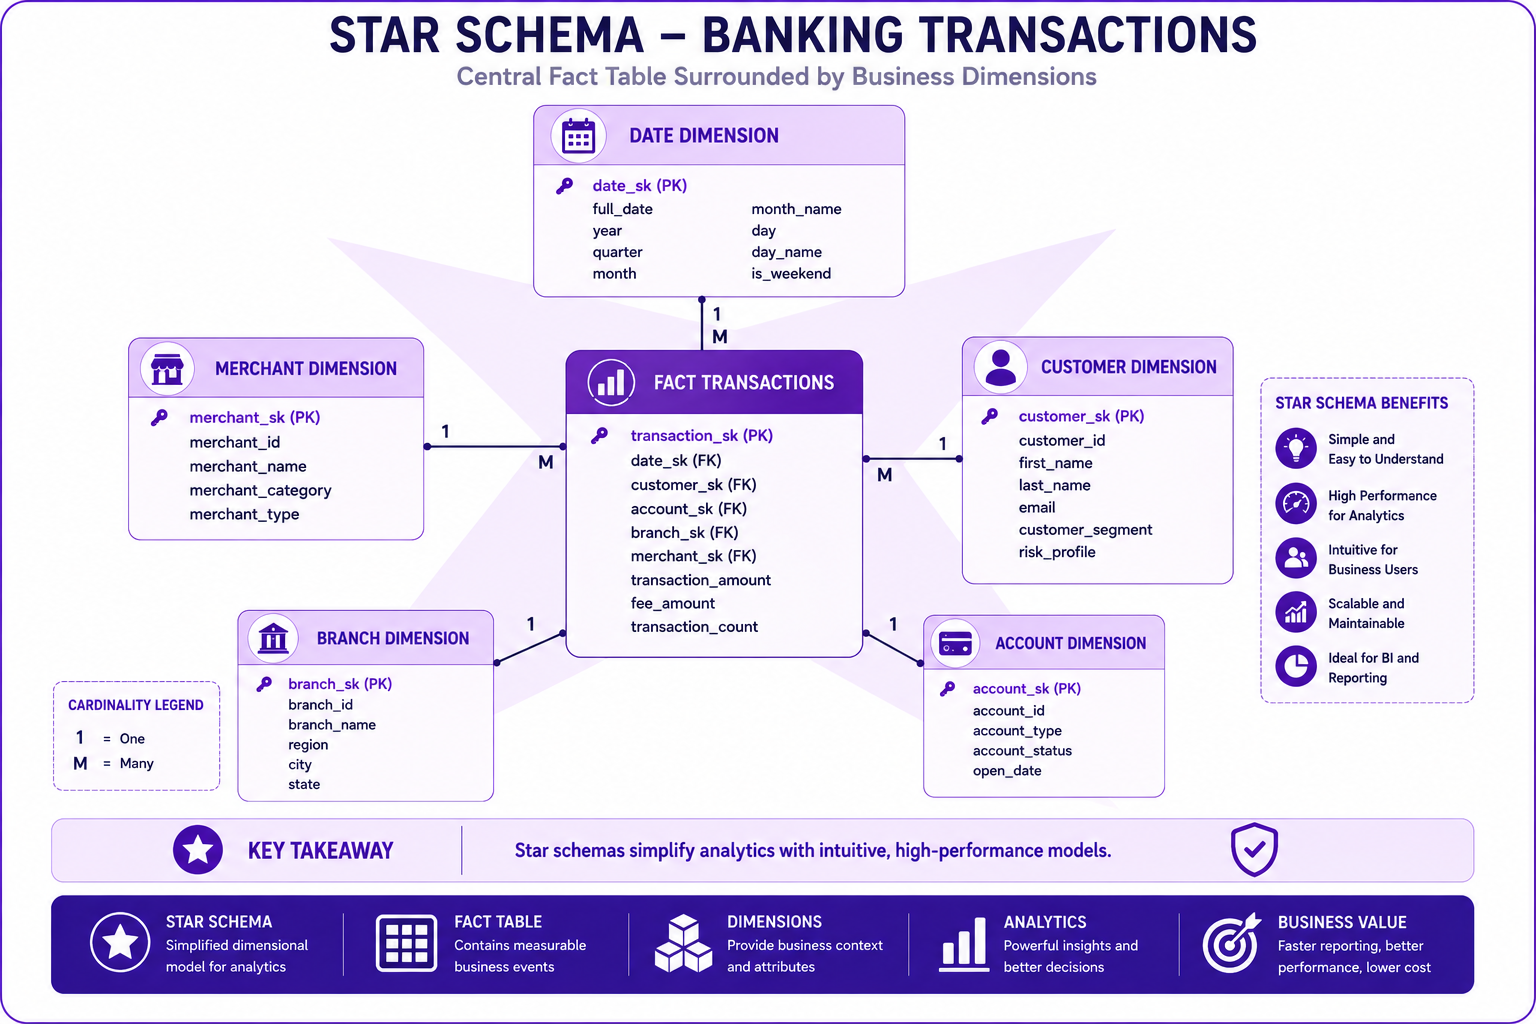
Prompt: Create a comprehensive Star Schema diagram showing the central fact table surrounded by dimension tables. Use a 5-table structure with purple gradient theme:
Center: Fact Table - Purple #AB47BC
- Title: "Fact Transactions"
- Fields: transaction_sk (PK), date_sk, customer_sk, account_sk, branch_sk, merchant_sk, transaction_amount, fee_amount, transaction_count
- Icon: 📊 Fact icon
- Background: Darkest purple for center emphasis
Surrounding Tables (Clockwise from top):
Top: Date Dimension - Purple #E1BEE7
- Fields: date_sk (PK), full_date, year, quarter, month, month_name, day, day_name, is_weekend
- Icon: 📅
Right: Customer Dimension - Purple #CE93D8
- Fields: customer_sk (PK), customer_id, first_name, last_name, email, customer_segment, risk_profile
- Icon: 👤
Bottom Right: Account Dimension - Purple #CE93D8
- Fields: account_sk (PK), account_id, account_type, account_status, open_date
- Icon: 💳
Bottom Left: Branch Dimension - Purple #E1BEE7
- Fields: branch_sk (PK), branch_id, branch_name, region, city, state
- Icon: 🏢
Left: Merchant Dimension - Purple #CE93D8
- Fields: merchant_sk (PK), merchant_id, merchant_name, merchant_category, merchant_type
- Icon: 🏪
Use connector lines from fact table to each dimension with cardinality indicators (1, M). Add a star shape overlay or background pattern. Include key takeaway at bottom: "Star schemas simplify analytics with intuitive, high-performance models." Footer tags: Star Schema, Fact Table, Dimensions, Analytics. Enterprise-style clean layout with rounded corners.
Snowflake Schema
What is a Snowflake Schema?
A snowflake schema is a normalized version of a star schema where dimension tables are further normalized.
Snowflake Schema = Star Schema + Normalized Dimensions
Snowflake vs Star Schema
| Aspect | Star Schema | Snowflake Schema |
|---|---|---|
| Dimension Normalization | Denormalized | Normalized |
| Query Performance | Faster | Slower |
| Storage | More | Less |
| Query Complexity | Simpler | Complex |
| Usability | Easier | Harder |
| Maintenance | More complex | Easier |
| Use Case | BI, Analytics | Data warehouses |
Snowflake Schema Example
-- Snowflake Schema with Normalized Dimensions
-- Fact Table (same as star)
CREATE OR REPLACE TABLE banking.fact_transactions (
  transaction_sk STRING PRIMARY KEY,
  date_sk STRING,
  customer_sk STRING,
  account_sk STRING,
  branch_sk STRING,
  merchant_sk STRING,
  transaction_amount NUMERIC,
  fee_amount NUMERIC,
  transaction_count INT
);

-- Normalized Customer Dimension
CREATE OR REPLACE TABLE banking.dim_customer (
  customer_sk STRING PRIMARY KEY,
  customer_id STRING,
  first_name STRING,
  last_name STRING,
  email STRING,
  address_sk STRING,      -- Foreign key to address dimension
  segment_sk STRING       -- Foreign key to segment dimension
);

-- Address Sub-Dimension
CREATE OR REPLACE TABLE banking.dim_address (
  address_sk STRING PRIMARY KEY,
  street STRING,
  city STRING,
  state STRING,
  zip_code STRING,
  country STRING
);

-- Segment Sub-Dimension
CREATE OR REPLACE TABLE banking.dim_segment (
  segment_sk STRING PRIMARY KEY,
  segment_name STRING,
  risk_profile STRING,
  description STRING
);
Dimension Hierarchies
What are Dimension Hierarchies?
Dimension hierarchies define drill-down paths within dimensions for analytical reporting.
Hierarchy = Parent-Child Relationships + Drill-Down Paths + Aggregation Levels
Common Hierarchies
| Dimension | Hierarchy | Banking Example |
|---|---|---|
| Date | Year → Quarter → Month → Day | 2024 → Q1 → January → 15 |
| Location | Country → Region → State → City | USA → Northeast → NY → New York |
| Customer | Segment → Sub-Segment → Individual | Premium → Gold → John Doe |
| Product | Category → Type → Product | Loans → Mortgage → 30-Year Fixed |
| Account | Type → Sub-Type → Account | Savings → High-Yield → A001 |
Hierarchy Implementation
-- Date Hierarchy
CREATE OR REPLACE TABLE banking.dim_date (
  date_sk STRING PRIMARY KEY,
  full_date DATE,
  -- Year hierarchy
  year INT,
  -- Quarter hierarchy
  quarter INT,
  -- Month hierarchy
  month INT,
  month_name STRING,
  -- Day hierarchy
  day INT,
  day_name STRING,
  day_of_week INT,
  -- Additional attributes
  is_weekend BOOLEAN,
  is_holiday BOOLEAN,
  holiday_name STRING
);

-- Location Hierarchy
CREATE OR REPLACE TABLE banking.dim_branch (
  branch_sk STRING PRIMARY KEY,
  branch_id STRING,
  branch_name STRING,
  -- Country hierarchy
  country STRING,
  -- Region hierarchy
  region STRING,
  -- State hierarchy
  state STRING,
  -- City hierarchy
  city STRING,
  -- Postal hierarchy
  postal_code STRING
);
Fact Table Types
Transaction Fact Table
-- One row per transaction
CREATE OR REPLACE TABLE banking.fact_transactions (
  transaction_sk STRING PRIMARY KEY,
  date_sk STRING,
  customer_sk STRING,
  account_sk STRING,
  branch_sk STRING,
  merchant_sk STRING,
  transaction_amount NUMERIC,
  fee_amount NUMERIC,
  tax_amount NUMERIC,
  transaction_count INT DEFAULT 1,
  transaction_id STRING   -- Degenerate dimension
)
PARTITION BY date_sk
CLUSTER BY customer_sk, account_sk;
Periodic Snapshot Fact Table
-- One row per account per day
CREATE OR REPLACE TABLE banking.fact_account_balance (
  balance_sk STRING PRIMARY KEY,
  date_sk STRING,
  account_sk STRING,
  customer_sk STRING,
  branch_sk STRING,
  opening_balance NUMERIC,
  closing_balance NUMERIC,
  average_balance NUMERIC,
  min_balance NUMERIC,
  max_balance NUMERIC,
  transaction_count INT,
  total_deposits NUMERIC,
  total_withdrawals NUMERIC
)
PARTITION BY date_sk
CLUSTER BY account_sk, customer_sk;
Accumulating Snapshot Fact Table
-- Track loan lifecycle
CREATE OR REPLACE TABLE banking.fact_loan_lifecycle (
  loan_sk STRING PRIMARY KEY,
  loan_id STRING,
  date_application DATE,
  date_approval DATE,
  date_disbursement DATE,
  date_first_payment DATE,
  date_maturity DATE,
  date_closed DATE,
  customer_sk STRING,
  branch_sk STRING,
  loan_amount NUMERIC,
  interest_rate NUMERIC,
  current_balance NUMERIC,
  status STRING
)
PARTITION BY date_application
CLUSTER BY customer_sk;
Dimensional Modeling Best Practices
| # | Best Practice |
|---|---|
| 1 | Choose the right grain for each fact table |
| 2 | Use surrogate keys for all dimensions |
| 3 | Denormalize dimensions for performance |
| 4 | Use consistent naming conventions |
| 5 | Include date/time dimensions for time-based analysis |
| 6 | Maintain dimension hierarchies |
| 7 | Implement SCD Type 2 for changing attributes |
| 8 | Optimize for query patterns |
| 9 | Use partitioning and clustering |
| 10 | Document dimension attributes |
Common Mistakes
| # | Common Mistake | Better Approach |
|---|---|---|
| 1 | Choosing wrong grain | Define grain based on business requirements |
| 2 | Over-normalizing dimensions | Denormalize for performance |
| 3 | Not using surrogate keys | Always use surrogate keys |
| 4 | Missing date dimension | Always include date dimension |
| 5 | Inconsistent naming | Use consistent naming conventions |
| 6 | No hierarchies | Define hierarchies for drill-down |
| 7 | Ignoring SCD | Implement appropriate SCD type |
| 8 | Complex fact tables | Keep fact tables simple |
| 9 | No documentation | Document all dimensions and attributes |
| 10 | Not testing performance | Test and optimize queries |
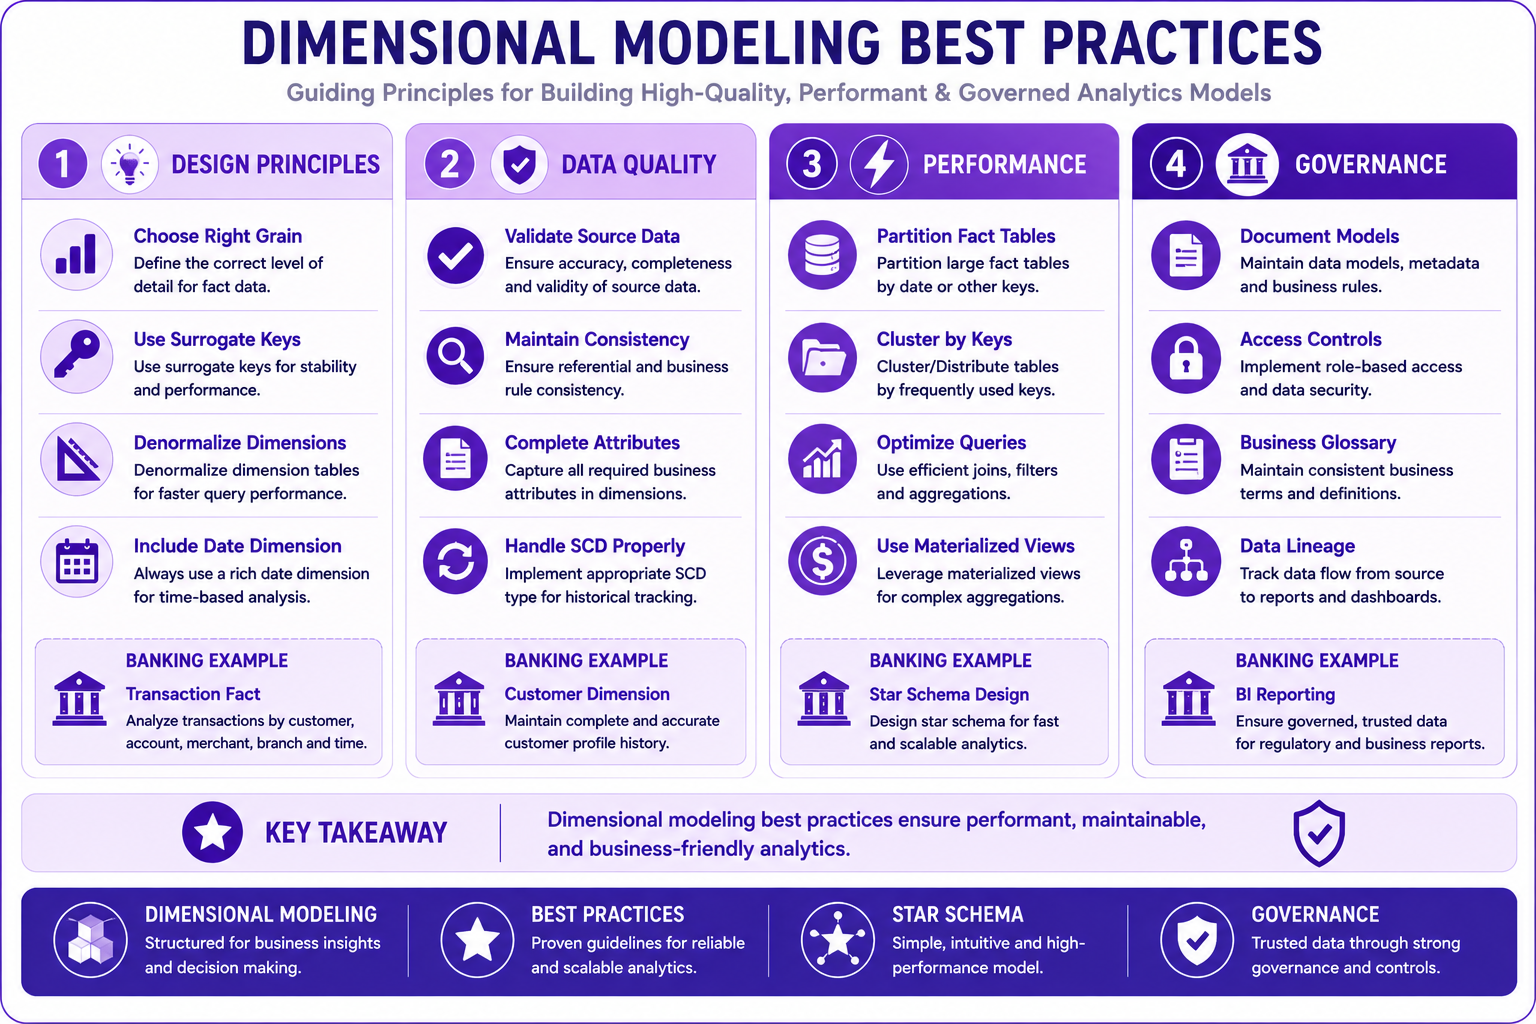
Prompt: Create a dimensional modeling best practices diagram. Use a 4-column structure with purple gradient theme:
Column 1: Design Principles (Left) - Purple #E1BEE7
- Title: "Design Principles"
- 📊 "Choose Right Grain"
- 🔑 "Use Surrogate Keys"
- 📐 "Denormalize Dimensions"
- 📅 "Include Date Dimension"
- Banking Example: "Transaction Fact"
Column 2: Data Quality - Purple #CE93D8
- Title: "Data Quality"
- ✅ "Validate Source Data"
- 🔍 "Maintain Consistency"
- 📝 "Complete Attributes"
- 🔄 "Handle SCD Properly"
- Banking Example: "Customer Dimension"
Column 3: Performance - Purple #AB47BC
- Title: "Performance"
- ⚡ "Partition Fact Tables"
- 🗂️ "Cluster by Keys"
- 📈 "Optimize Queries"
- 💰 "Use Materialized Views"
- Banking Example: "Star Schema Design"
Column 4: Governance - Purple #7B1FA2
- Title: "Governance"
- 🏛️ "Document Models"
- 🔒 "Access Controls"
- 📋 "Business Glossary"
- 📝 "Data Lineage"
- Banking Example: "BI Reporting"
At bottom: Key takeaway: "Dimensional modeling best practices ensure performant, maintainable, and business-friendly analytics." Footer tags: Dimensional Modeling, Best Practices, Star Schema, Governance. Enterprise-style clean layout with rounded corners.
Banking Dimensional Model
Complete Banking Dimensional Model
-- 1. Date Dimension (Common to all facts)
CREATE OR REPLACE TABLE banking.dim_date (
  date_sk STRING PRIMARY KEY,
  full_date DATE,
  year INT,
  quarter INT,
  month INT,
  month_name STRING,
  day INT,
  day_name STRING,
  day_of_week INT,
  week_of_year INT,
  is_weekend BOOLEAN,
  is_holiday BOOLEAN
);

-- 2. Customer Dimension
CREATE OR REPLACE TABLE banking.dim_customer (
  customer_sk STRING PRIMARY KEY,
  customer_id STRING,
  first_name STRING,
  last_name STRING,
  email STRING,
  phone STRING,
  date_of_birth DATE,
  age INT,
  customer_segment STRING,
  risk_profile STRING,
  valid_from DATE,
  valid_to DATE,
  is_current BOOLEAN
);

-- 3. Account Dimension
CREATE OR REPLACE TABLE banking.dim_account (
  account_sk STRING PRIMARY KEY,
  account_id STRING,
  account_type STRING,
  account_sub_type STRING,
  account_status STRING,
  open_date DATE,
  close_date DATE,
  currency STRING,
  valid_from DATE,
  valid_to DATE,
  is_current BOOLEAN
);

-- 4. Branch Dimension
CREATE OR REPLACE TABLE banking.dim_branch (
  branch_sk STRING PRIMARY KEY,
  branch_id STRING,
  branch_name STRING,
  branch_type STRING,
  region STRING,
  country STRING,
  state STRING,
  city STRING,
  postal_code STRING
);

-- 5. Merchant Dimension
CREATE OR REPLACE TABLE banking.dim_merchant (
  merchant_sk STRING PRIMARY KEY,
  merchant_id STRING,
  merchant_name STRING,
  merchant_category STRING,
  merchant_type STRING,
  country STRING,
  city STRING
);

-- 6. Product Dimension
CREATE OR REPLACE TABLE banking.dim_product (
  product_sk STRING PRIMARY KEY,
  product_id STRING,
  product_name STRING,
  product_category STRING,
  product_sub_category STRING,
  product_type STRING,
  risk_level STRING
);

-- 7. Transaction Fact Table
CREATE OR REPLACE TABLE banking.fact_transactions (
  transaction_sk STRING PRIMARY KEY,
  date_sk STRING,
  customer_sk STRING,
  account_sk STRING,
  branch_sk STRING,
  merchant_sk STRING,
  product_sk STRING,
  transaction_amount NUMERIC,
  fee_amount NUMERIC,
  tax_amount NUMERIC,
  transaction_count INT DEFAULT 1,
  transaction_id STRING
)
PARTITION BY date_sk
CLUSTER BY customer_sk, account_sk;
Interview Questions
-
What is dimensional modeling?
-
What is the difference between a fact and a dimension?
-
What is a star schema?
-
What is a snowflake schema?
-
What is the Kimball methodology?
-
What is a fact grain?
-
What are the different types of fact tables?
-
What is a dimension hierarchy?
-
How do you handle slowly changing dimensions?
-
What is the difference between star and snowflake schemas?
-
Why use surrogate keys in dimensional modeling?
-
What are the best practices for dimensional modeling?
Practice Exercises
-
Design a star schema for banking transactions.
-
Create a date dimension with full hierarchy.
-
Implement a customer dimension with SCD Type 2.
-
Design a periodic snapshot fact table for account balances.
-
Create an accumulating snapshot for loan lifecycle.
-
Build dimension hierarchies for location and product.
-
Design a factless fact table for customer enrollment.
-
Implement a snowflake schema for customer dimension.
-
Create a materialized view for common aggregations.
-
Optimize queries using partition and clustering.
Key Takeaways
| # | Takeaway |
|---|---|
| 1 | Dimensional modeling is optimized for analytics |
| 2 | Fact tables contain quantitative measures |
| 3 | Dimension tables provide business context |
| 4 | Star schema is the preferred dimensional model |
| 5 | Choose grain carefully for each fact table |
| 6 | Use surrogate keys for all dimensions |
| 7 | Implement hierarchies for drill-down analysis |
| 8 | Balance performance with usability |
Chapter Summary
In this chapter, you learned:
- ✅ What dimensional modeling is and why it matters
- ✅ The Kimball methodology approach
- ✅ Fact tables and their characteristics
- ✅ Dimension tables and their role
- ✅ Star schema design
- ✅ Snowflake schema design
- ✅ Dimension hierarchies
- ✅ Fact table types (transaction, periodic, accumulating)
- ✅ Best practices and common mistakes
- ✅ Banking dimensional model
You now understand how to design effective dimensional models for business intelligence and analytics.
Next Chapter
👉 Next Chapter: Star Schema